Fig 5.
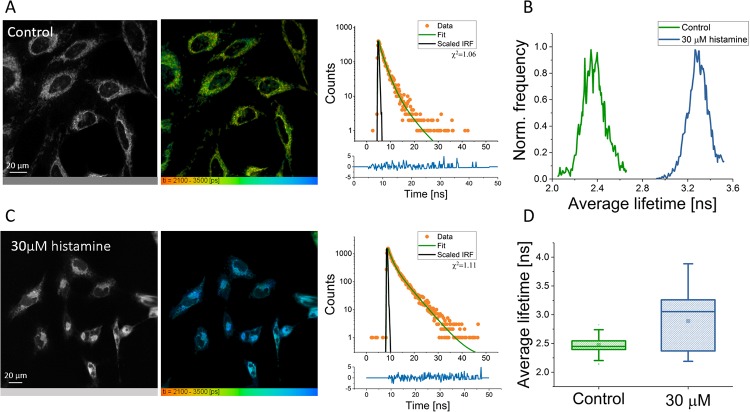
Representative fluorescence intensity and FLIM image of control HeLa cells (A) and of histamine-treated HeLa cells (C), along with representative decays, showing fit and scaled IRF. Lifetime range for images is 2100-3500 ps. 1μM FMR-1 in both conditions. B) Representative average fluorescence lifetime histograms from cells in each condition. D) Box plot showing the average lifetimes of cells in the control (n = 140) and the histamine condition (n = 83). Each data point is a cell.

