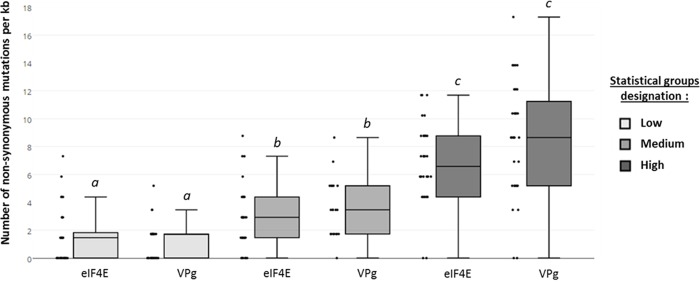
Fig 1. Distribution of the number of non-synonymous mutations in sequenced variants sampled from each VPg and eIF4E mutant library.
Black dots: number of NS mutation per kb retrieved from each of the 32 variants sequenced. a, b and c are 3 significantly different statistical groups (p-value cut-off at 0.01, Kruskal-Wallis test).

