Fig 1.

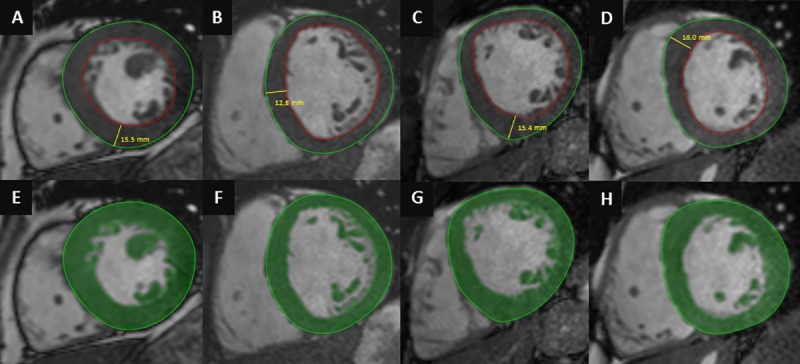
Conventional quantification (A,B,C,D) and threshold-based quantification method (E,F,G,H) in HCM (A,E), healthy athlete (B,F), healthy athlete with EDWT in the grey zone of hypertrophy (C,G) and athlete with HCM (D,H).

Conventional quantification (A,B,C,D) and threshold-based quantification method (E,F,G,H) in HCM (A,E), healthy athlete (B,F), healthy athlete with EDWT in the grey zone of hypertrophy (C,G) and athlete with HCM (D,H).