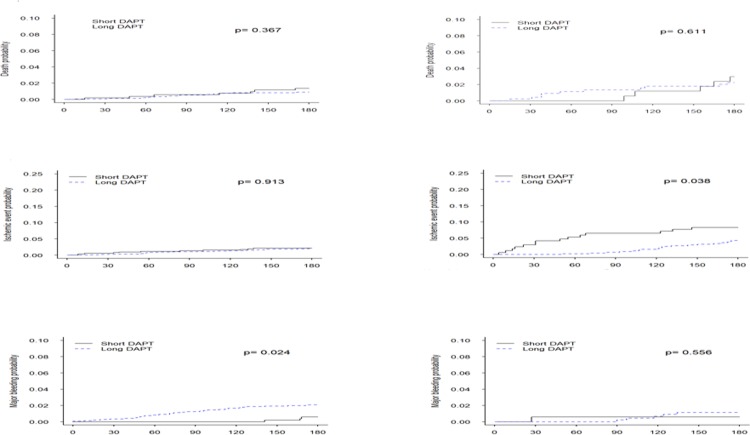
Fig 6. Kaplan-Meier curves for clinical outcomes according to simplified risk score stratum.
Kaplan Meier curves for the overall mortality (top row), composite ischaemic endpoint (middle row), and bleeding (bottom row) of patients treated with shorter (6 months) vs. longer (6–12 months) DAPT, stratified by quartiles of the risk score–lower three quartiles (left column) and upper quartile (right column). DAPT = dual antiplatelet therapy.

