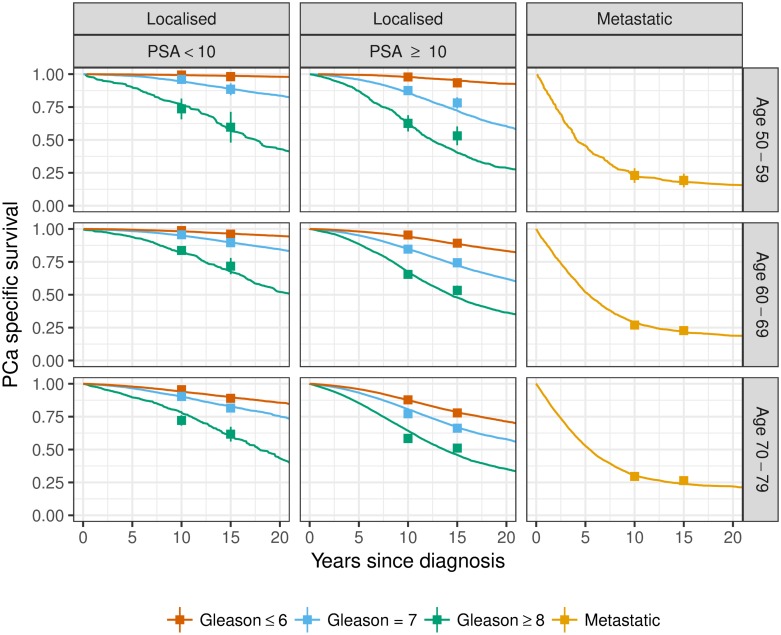
Fig 4. Simulated survival from the calibrated model displayed as Kaplan-Meier survival curves together with the observed 10- and 15-year survival from PCBaSe displayed as point estimates with 95% confidence intervals.
Survival is stratified by age at diagnosis, PSA at diagnosis, Gleason score and cancer extent.

