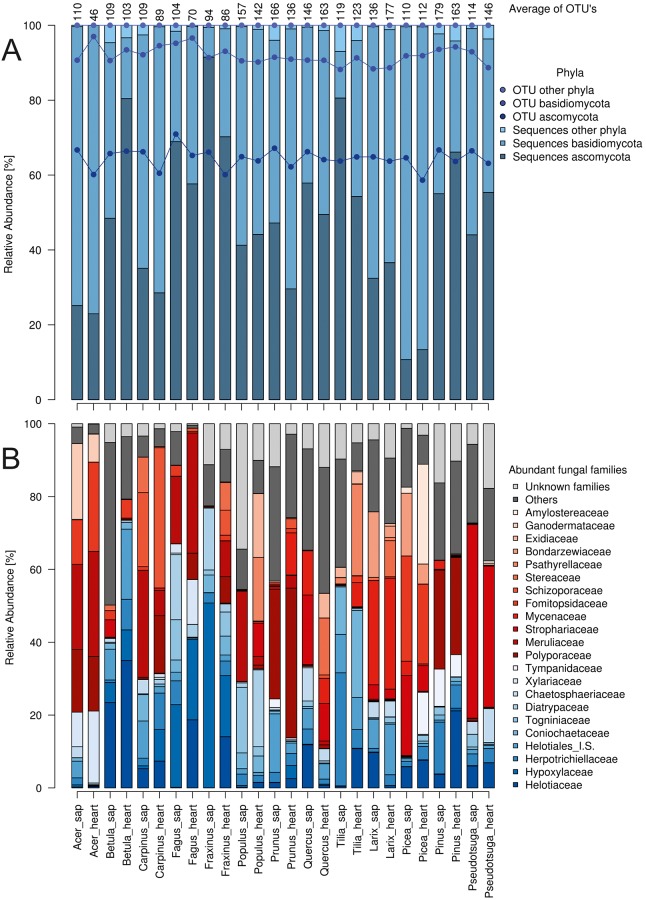
Fig 1. Fungal mean relative abundances.
A) Sequence abundance (bars) and OTU affiliation (dots) with fungal phyla in 13 temperate European tree species in sapwood (sap) and heartwood (heart) (n = 3). Mean numbers of OTUs per tree sample are given at the top. B) Sequence abundance of the 22 most abundant fungal families (>20,000 sequences). Ascomycota are labeled in blue and Basidiomycota in red.

