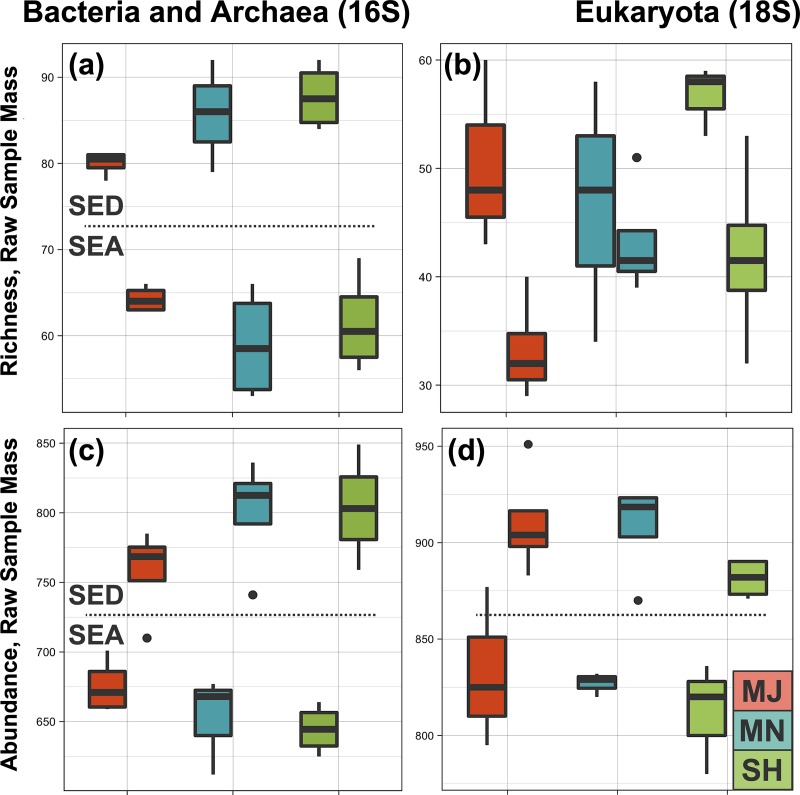
Fig 2. Microbial community richness and abundance.
(a-b) Boxplot comparisons of rarefied bacterial and archaeal (16S) and eukaryal (18S) richness estimates for different environment types (sediment and seawater) and by sampling site (major outlet/MJ, minor outlet/MN, sheltered/SH), with a p value (p < 0.001) for environment type. (c-d) Boxplot comparisons of rarefied bacterial and archaeal (16S) and eukaryal (18S) abundance estimates for different environment types (sediment and seawater) and by sampling site (major outlet/MJ, minor outlet/MN, sheltered/SH), with a p value (p < 0.001) for environment type.

