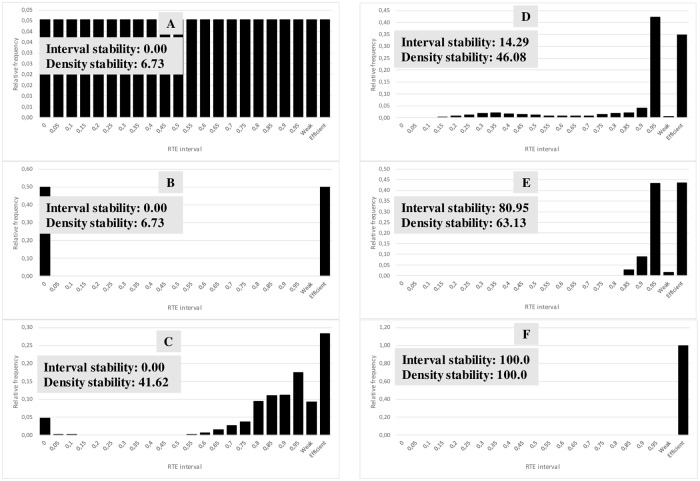
Fig 3. Some examples of different RTE statistical distributions and their corresponding stabilities (inttot = 22, prob = 0.8, minln = 1.2909 and maxln = 4.6051).
For the example in E: ninti = 5, acprobi = 0.88, nintprobi = 3, wint = 0.5 and wden = 0.5. Finally, the resulting stabE = 72.04 (likely stable).

