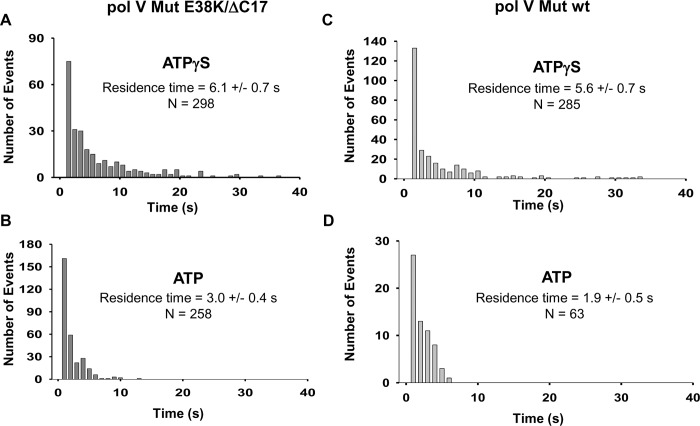
Fig 9. Histograms for DNA binding residence times of activated pol V Mut.
Histograms representing DNA residence times of ATPγS/ATP-activated 1 nM pol V Mut E38K/ΔC17 (A-B) and 5 nM pol V Mut wt (C-D). Pol V Mut residence times were calculated by fitting the data to a single exponential decay function.

