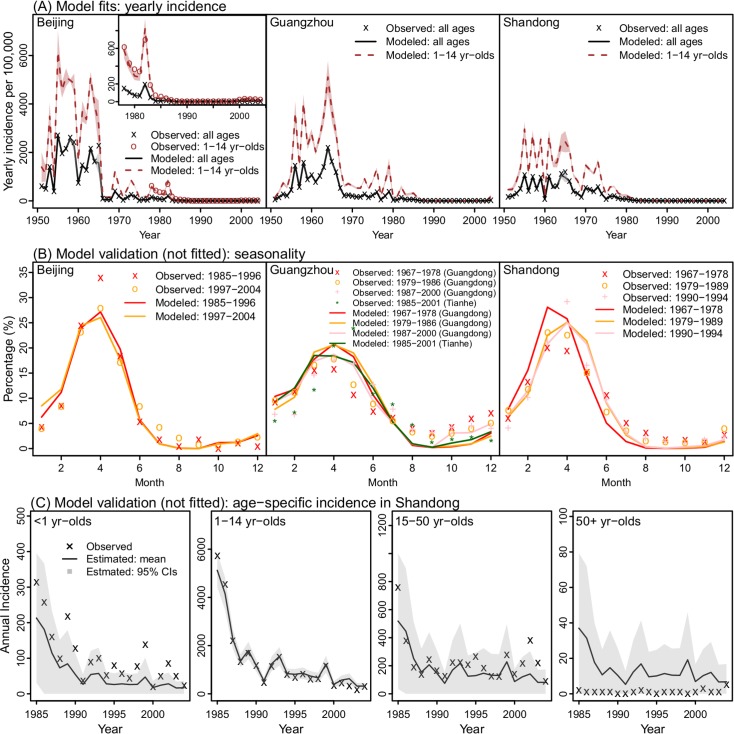
Fig 3. Model fittings of observations in Beijing, Guangzhou, and Shandong.
(A) Model estimates of yearly incidence for the entire population and children 1–14 yr of age, compared to observations. Shaded areas (overall incidence in grey and incidence among children in brown) show the 95% Credible Intervals (CIs); some years are not clearly visible due to the narrow range. For Beijing, incidence data for children (1978–2004) are also shown for comparison with model estimates; inset shows model fits for more recent years when incidence was much lower. (B) Model estimated seasonal patterns as compared to available quasi-decadal monthly incidence. Note these data were used for selection of parameter priors but not used directly for model fitting (see Methods). (C) Model estimated age-specific yearly incidence as compared to observations in Shandong. The observations are numbers of measles cases in different ages reported in S. Li et al. 2017 and were not used in model fitting or optimization (i.e. out-of-sample data).

