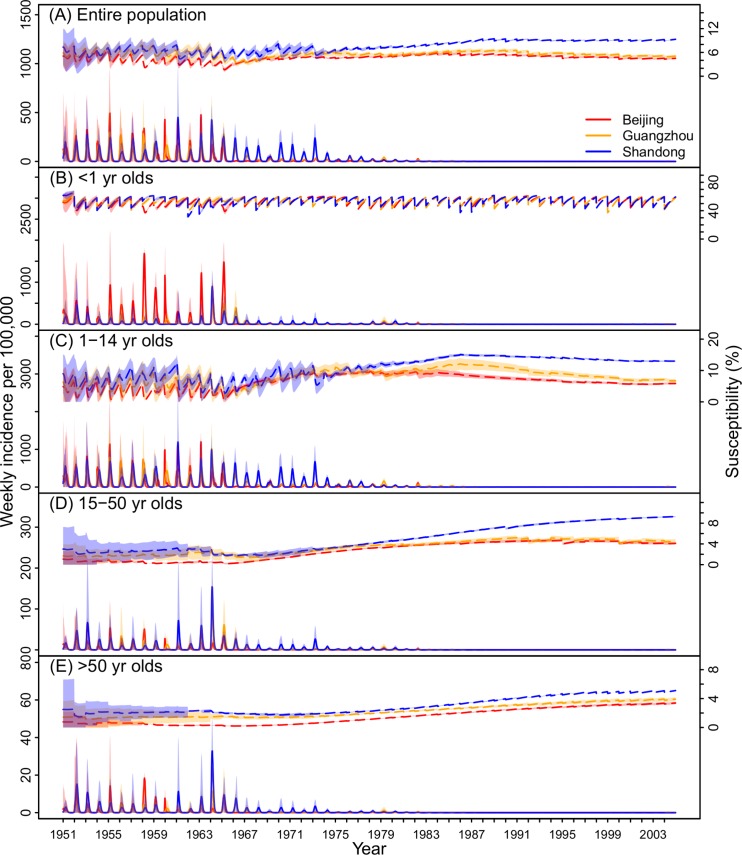
Fig 4. Estimates of key model variables during 1951–2004.
Estimated weekly total incidence (solid, y-axis on the left) and population susceptibility (dashed, y-axis on the right) in Beijing, Guangzhou, and Shandong for (A) the entire population, (B) <1 yr olds, (C) 1–14 yr olds, (D) 15–50 yr olds, and (E) >50 yr olds. Shaded areas show the 95% CIs.

