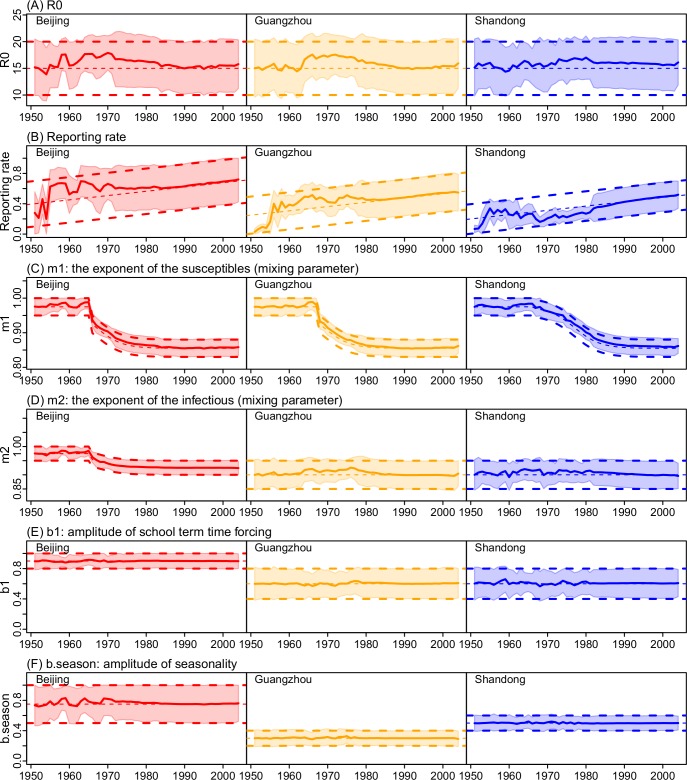
Fig 5. Estimates of key model parameters during 1951–2004.
(A) R0; (B) Reporting rate; (C) Mixing parameter m1; (D) Mixing parameter m2; (E) Amplitude of school term time forcing (b1); and (F) Amplitude of seasonality (b.season). Solid lines show the mean posterior estimates and shaded areas show the 95% CIs; thick dashed lines show the prior ranges and thin dashed lines show the mean values of the priors. Estimates for other parameters are shown in S1 Fig.

