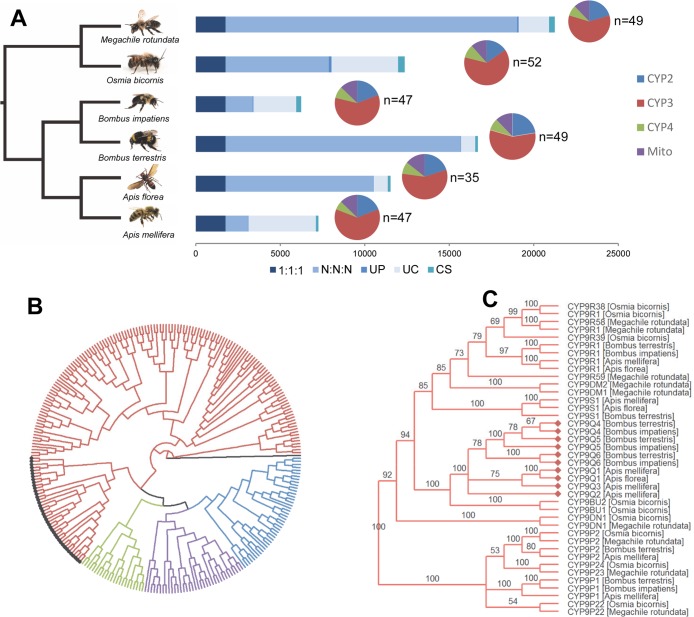
Fig 1. Comparison of the CYPome of O. bicornis with other bee species.
(A) Ortholog analysis of O. bicornis with five other bee species. 1:1:1 indicates common orthologs with the same number of copies in different species, N:N:N indicates common orthologs with different copy numbers in different species, UP indicates species specific paralogs, UC indicates all genes which were not assigned to a gene family, CS indicates clade specific genes. Pie charts show the percentage of genes in the CYPome of each bee species in the CYP2, 3, 4 and mitochondrial clade. (B) Rooted maximum likelihood consensus phylogenetic tree of the CYPome of the same species shown in panel A. Genes are coloured according to their adscription to different P450 clades. (C) Maximum likelihood phylogenetic tree of the CYP9 family of P450s in the same species, P450s belonging to the CYP9Q subfamily are highlighted using filled diamonds.

