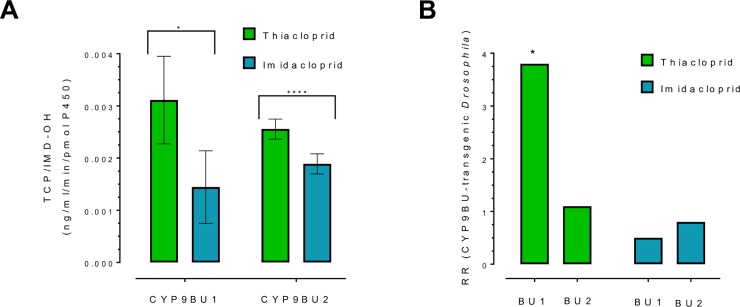
Fig 3. Identification of neonicotinoid metabolising P450s in O. bicornis.
(A) Metabolism of thiacloprid and imidacloprid by recombinantly expressed CYP9BU1 and CYP9BU2. Production of 5-hydroxy thiacloprid and 5-hydroxy imidacloprid is displayed per pmol of P450 (*P<0.05, ****P<0.0001; paired t test). Error bars display standard deviation (n = 3). (B) Sensitivity of transgenic flies expressing CYP9BU1 and CYP9BU2 to thiacloprid and imidacloprid in insecticide bioassays. Data is expressed as resistance ratio (RR) compared to a control line (flies of the same genetic background but without the transgene). Significant changes in sensitivity between control and transgenic lines are indicated by an asterisk and are based on non-overlapping 95% fiducial limits of LC50 values (n = 5). See also S6 Table.

