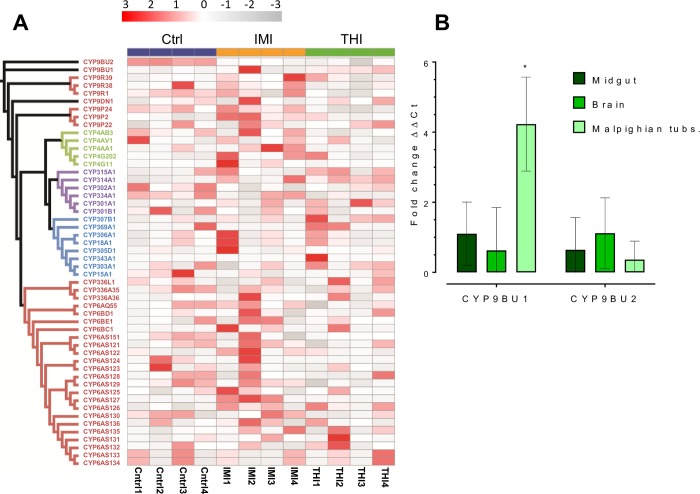
Fig 4. Expression of O. bicornis P450s after exposure to neonicotinoids and in different tissues.
(A) Expression heat map of O. bicornis P450s after exposure of female bees to imidacloprid (IMI), thiacloprid (THI) or insecticide dilutent (Ctrl). Expression in each of the four replicates per treatment is derived from scaled FPKM values for each P450 transcript. A maximum likelihood tree of Osmia bicornis P450s is shown to the left of the heatmap. (B) Relative expression (fold change) of O. bicornis thiacloprid metabolising CYP9 genes in different tissues of female bees measured by quantitative PCR. Significant differences (p<0.01) in expression between tissues is denoted using an asterisk above bars as determined by one-way ANOVA with post hoc Tukey HSD.

