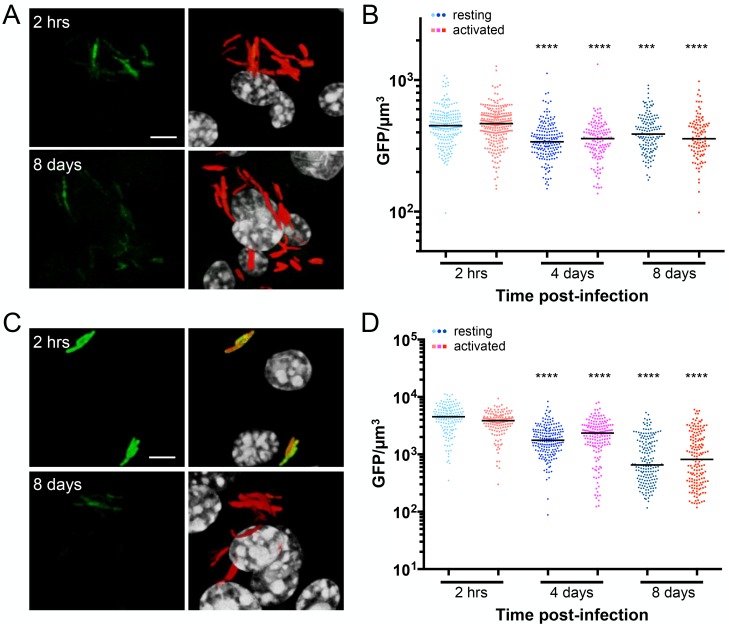
Fig 5. kdpF’::GFP is downregulated during macrophage infection.
(A and B) Expression of kdpF’::GFP is downregulated during Mtb infection of macrophages. Resting or activated macrophages were infected with CDC1551(kdpF’::GFP, smyc’::mCherry). (A) shows 3D confocal images of the beginning (2 hrs) and end (8 days) of infection. All bacteria are marked in red (smyc’::mCherry), the reporter is shown in green (kdpF’::GFP), and nuclei are shown in grayscale (DAPI). Scale bar 5 μm. (B) shows quantification of the GFP/μm3 signal for each bacterium measured from multiple 3D confocal images. Each point on the graph represents a bacterium or a tight cluster of bacteria (circles—Mtb in resting macrophages, squares—Mtb in activated macrophages). p-values were obtained with a Mann-Whitney statistical test, and is in comparison to the corresponding 2 hr data set in each case. *** p<0.001, **** p<0.0001. (C and D) Pre-growth of Mtb in K+-free media enhances kdpF’::GFP reporter signal decrease during infection. CDC1551(kdpF’::GFP, smyc’::mCherry) was grown in K+-free media for 6 days prior to infecting resting or activated murine macrophages. (C) shows 3D confocal images of the infection at the beginning (2 hrs) and end (8 days) of the infection. All bacteria are marked in red (smyc’::mCherry), the reporter is shown in green (kdpF’::GFP), and nuclei are shown in grayscale (DAPI). Scale bar 5 μm. (D) shows quantification of the bacterial GFP/μm3 signal, determined as in (B).

