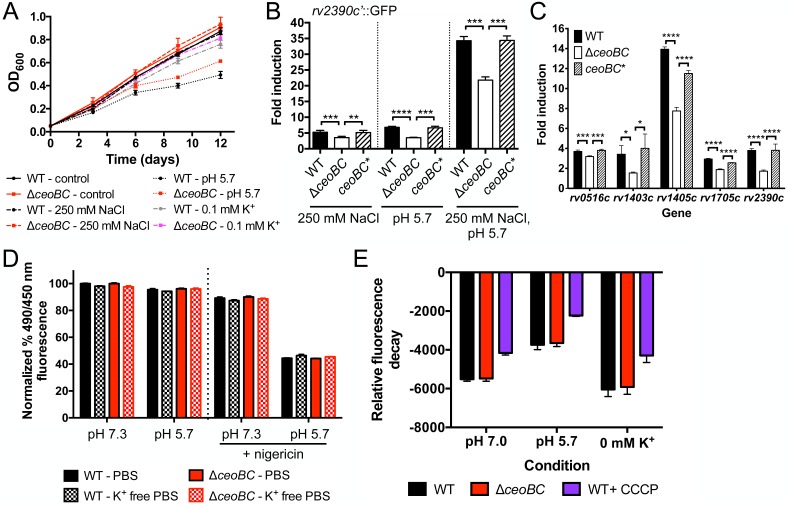
Fig 7. Mtb K+ homeostasis augments the bacterial response to Cl- and pH.
(A) Mtb ΔceoBC mutant growth during environmental stress. WT or ΔceoBC mutant Mtb were grown in standard pH 7.0 media ± 250 mM NaCl, pH 5.7 media, or in K+-free 7H9 media, pH 7.0, supplemented with 0.1 mM KCl, and growth tracked over time. Data are shown as mean ± SD from 3 independent experiments. (B and C) Mtb ΔceoBC mutant has an attenuated response to Cl- and acidic pH. In (B), WT, ΔceoBC, or ceoBC* (complemented mutant) Mtb expressing the rv2390c’::GFP reporter were grown in pH 7 or pH 5.7 media, ± 250 mM NaCl. GFP signal in fixed samples was measured by FACS, with fold signal induction compared to the corresponding strain grown in pH 7 control media. Data are shown as means ± SD from 3 independent experiments. p-values were obtained with an unpaired t-test, ** p<0.01, *** p<0.001, **** p<0.0001. (C) shows qRT-PCR of gene expression changes in WT, ΔceoBC, or ceoBC* 4 hrs post-exposure to pH 7 media ± 250 mM NaCl. Fold induction is as compared to gene expression in pH 7 media for each strain. Data are shown as mean ± SD from 3 technical replicates, representative of 2 independent experiments. p-values were obtained with an unpaired t-test, * p<0.05, *** p<0.001, **** p<0.0001. (D) Maintenance of intrabacterial pH in the ΔceoBC mutant. WT or ΔceoBC mutant Mtb were incubated for 1 hour with 5-chloromethylfluorescein diacetate, before washing and exposure to PBS or K+-free PBS containing 0.05% tween 80, at pH 7.3 or pH 5.7. Fluorescence was read with a microplate reader at Ex. 450 nm and 490 nm, and Em. at 520 nm. 10 μM of the ionophore nigericin was added to assay control samples. Data were normalized as a percentage of the fluorescence ratios (Ex. 490 nm/Ex, 450 nm) observed in PBS, pH 7.3, for a given strain, and shown as means ± SD from 3 wells. The results are representative of 4 independent experiments. (E) ΔceoBC mutant maintains membrane potential during environmental stress. WT or ΔceoBC mutant Mtb were resuspended in pH 7 or pH 5.7 media, or in K+-free 7H9, pH 7 media containing 0.5 mg/l of rhodamine 123. 50 μM of the protonophore carbonyl cyanide m-chlorophenylhydrazone was added to assay control samples. Fluorescence decay was tracked every 10 minutes for 4 hours with a microplate reader at Ex. 485 nm/Em. 527 nm, and normalized to initial probe fluorescence for each strain and condition. The assay was repeated 4 times, and data are shown as means ± SD from 8 wells across 2 independent experiments.

