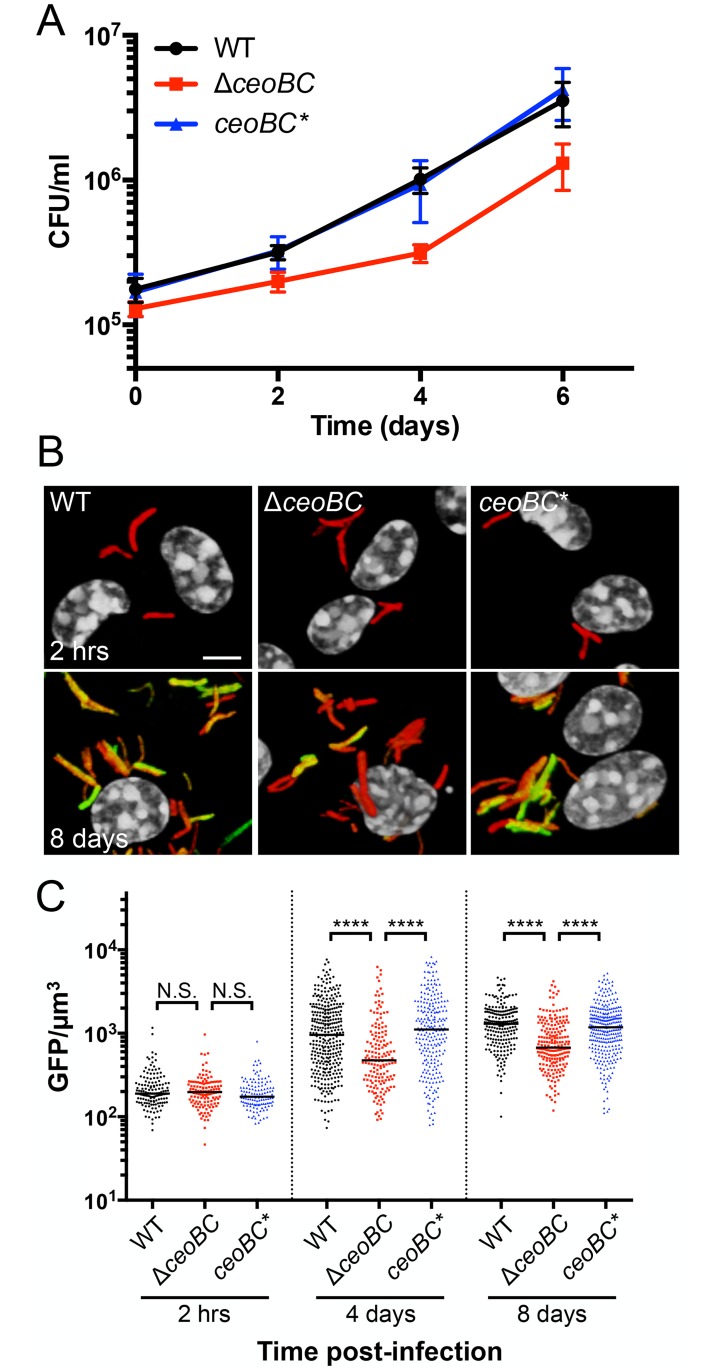
Fig 8. Disruption of bacterial K+ homeostasis decreases Mtb colonization of macrophages.
(A) Mtb ΔceoBC mutant is attenuated for macrophage colonization. Murine bone marrow-derived macrophages were infected with WT, ΔceoBC, or ceoBC* (complemented mutant) Mtb, and CFUs tracked over time. Data are shown as means ± SD from 5–6 wells, representative of 3–4 independent experiments. (B and C) Mtb ΔceoBC mutant exhibits decreased rv2390c’::GFP induction response during macrophage infection. Activated murine bone marrow-derived macrophages were infected with WT, ΔceoBC, or ceoBC* Mtb expressing the rv2390c’::GFP, smyc’::mCherry reporter. (B) shows 3D confocal images of the beginning (2 hrs) and end (8 days) of infection. All bacteria are marked in red (smyc’::mCherry), the reporter is shown in green (rv2390c’::GFP), and nuclei are shown in grayscale (DAPI). Scale bar 5 μm. (C) shows quantification of the GFP/μm3 signal for each bacterium measured from multiple 3D confocal images. Each point on the graph represents a bacterium or a tight cluster of bacteria (black circles—WT, red squares– ΔceoBC, blue triangles—ceoBC*). p-values were obtained with a Mann-Whitney statistical test. N.S. not significant, **** p<0.0001.

