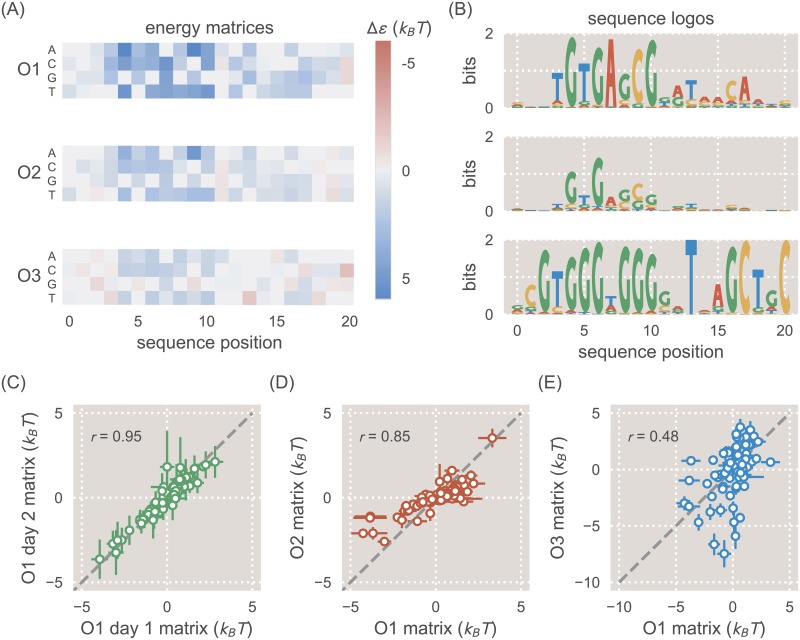
Fig 2. Energy matrices and sequence logos for the natural lac operators.
A: Energy matrices show how mutations can be expected to affect binding energy. Reference sequences for each energy matrix (either the O1, O2, or O3 sequence) have been set at 0 kBT (gray squares), and the energy values at all other positions of the matrix are thus relative to the reference sequence. Red squares represent mutations that create a stronger binding energy than the reference sequence, and blue squares represent mutations that create a weaker binding energy. In columns where multiple squares are gray, this indicates that there is no significant change in binding energy relative to the reference sequence. B: While the energy matrices are qualitatively similar for all three operators, the sequence logos indicate clear differences in the information that can be provided by each operator. The O1 and O2 operators produce similar sequence logos, but the O3 sequence logo incorrectly predicts the preferred binding sequence for LacI. The O3 sequence logo also indicates a much lower information content than for O1 and O2. C: Two separate biological replicates of a matrix derived from the O1 reference sequence (with repressor copy number R = 62) are plotted against one another. D: The O1 energy matrix is plotted against the O2 energy matrix, both derived from strains with R = 130. E: The O1 energy matrix is plotted against the O3 energy matrix, both derived from strains with R = 130.

