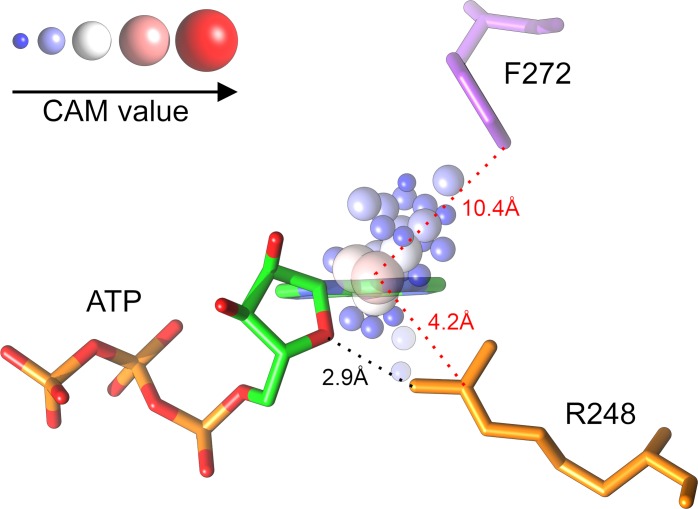
Fig 3. An example of class-activation map (CAM) grids within ligand-binding sites.
ATP bound to the human TRPV4 ankyrin repeat domain is shown as sticks colored by atom type (C–green, O–red, N–blue, and P–orange). Selected grid points are represented by spheres whose size and color depend on the assigned CAM value according to the scale in the top left corner. Two residues are shown, R248 (orange) forming a hydrogen bond with the ribose moiety of ATP and a more distant residue F272 (purple). A dotted black line represents a hydrogen bond, whereas dotted red lines mark the distance between protein residues and the highest-scoring grid point.

