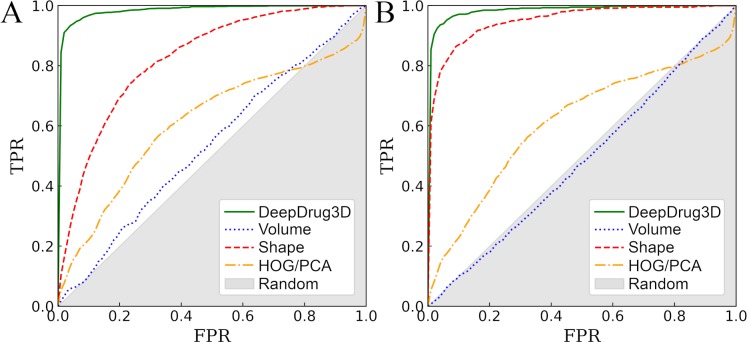
Fig 4. ROC plots evaluating the performance of various algorithms to classify ligand-binding sites.
DeepDrug3D is compared to volume- and shape-based approaches, as well as a classifier employing the histogram of gradients with principal component analysis (HOG/PCA) for (A) nucleotide- and (B) heme-binding pockets. The x-axis shows the false positive rate (FPR) and the y-axis shows the true positive rate (TPR). The gray area represents a random prediction.

