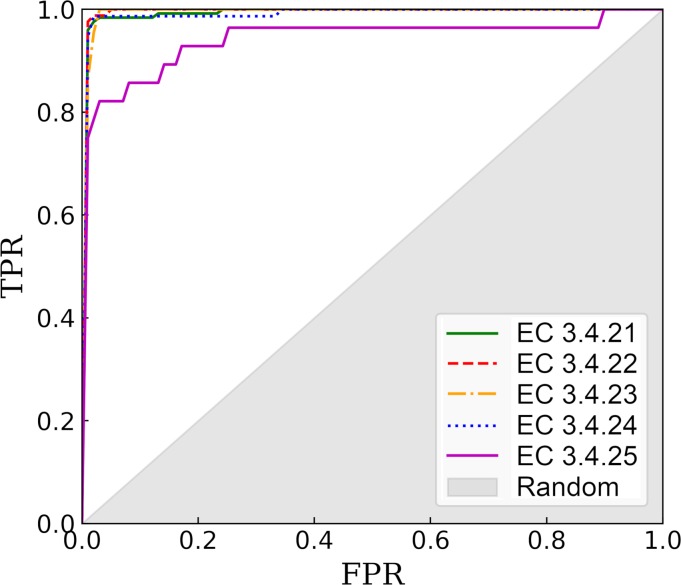
Fig 6. ROC plots evaluating the performance of DeepDrug3D against the peptidase dataset.
The performance is assessed individually for five groups of enzymes, serine endopeptidases (EC 3.4.21), cysteine endopeptidases (EC 3.4.22), aspartic endopeptidases (EC 3.4.23), metalloendopeptidases (EC 3.4.24), and threonine endopeptidases (EC 3.4.25). The x-axis shows the false positive rate (FPR) and the y-axis shows the true positive rate (TPR). The gray area represents a random prediction.

