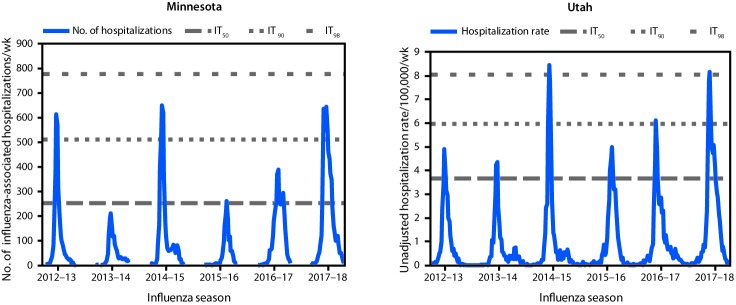
FIGURE.
Influenza-associated hospitalizations indicators and intensity thresholds — Minnesota*,† and Utah,§,¶ 2012–18 influenza seasons
Abbreviations: IT50 = intensity threshold at which there is a 50% chance of observing a higher value during 2017–18 based on historical (2012–13 through 2016–17) peak values; IT90 = intensity threshold at which there is a 10% chance of observing a higher value during 2017–18 based on historical (2012–13 through 2016–17) peak values; IT98 = intensity threshold at which there is a 2% chance of observing a higher value during 2017–18 based on historical (2012–13 through 2016–17) peak values.
* Reported to the Minnesota Department of Health.
† Minnesota intensity thresholds: IT50 = 255; IT90 = 511; IT98 = 778.
§ Reported to the Utah Department of Health.
¶ Utah intensity thresholds: IT50 = 3.66; IT90 = 5.99; IT98 = 8.06.

