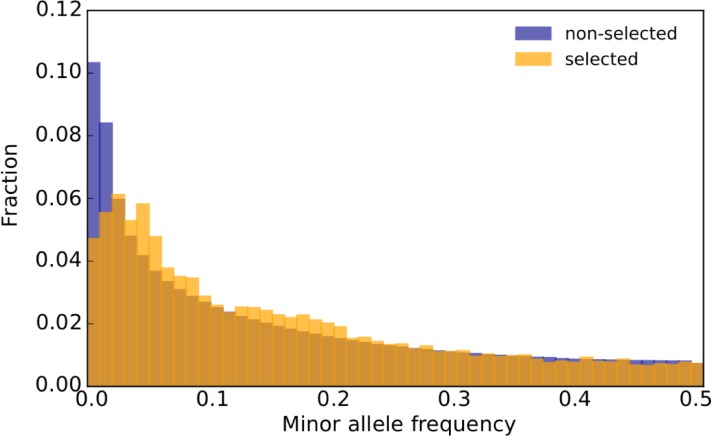
Fig 6. Selected alleles occur at higher frequency than neutral SNPs.
The folded SFS of marker SNPs from selected alleles (23,835 SNPs) and nonselected SNPs (5,066,625 SNPs) in ancestral population is plotted. SNPs that were not identified as markers of selected alleles are considered nonselected SNPs. The distributions of these two SNP classes differ significantly (two-sided Kolmogorov-Smirnov test, ks value = 0.086, p < 10−16). Data deposited in the Dryad Repository: https://doi.org/10.5061/dryad.rr137kn. SFS, site frequency spectrum; SNP, single nucleotide polymorphism.

