
Fig. 4.
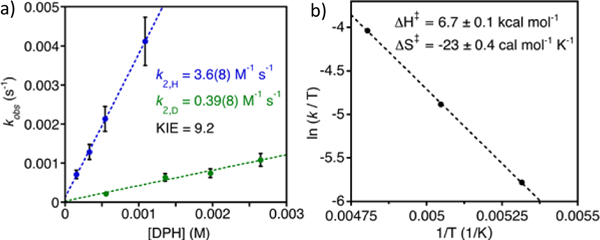
(a) Plot of pseudo-first-order rate constants (kobs) versus [DPH] (blue circles) or [DPH-d2] (green circles) together with best-fit lines. (b) Plot of ln (k/T) versus inverse temperature (Eyring Plot).
Official websites use .gov
A
.gov website belongs to an official
government organization in the United States.
Secure .gov websites use HTTPS
A lock (
) or https:// means you've safely
connected to the .gov website. Share sensitive
information only on official, secure websites.
(a) Plot of pseudo-first-order rate constants (kobs) versus [DPH] (blue circles) or [DPH-d2] (green circles) together with best-fit lines. (b) Plot of ln (k/T) versus inverse temperature (Eyring Plot).