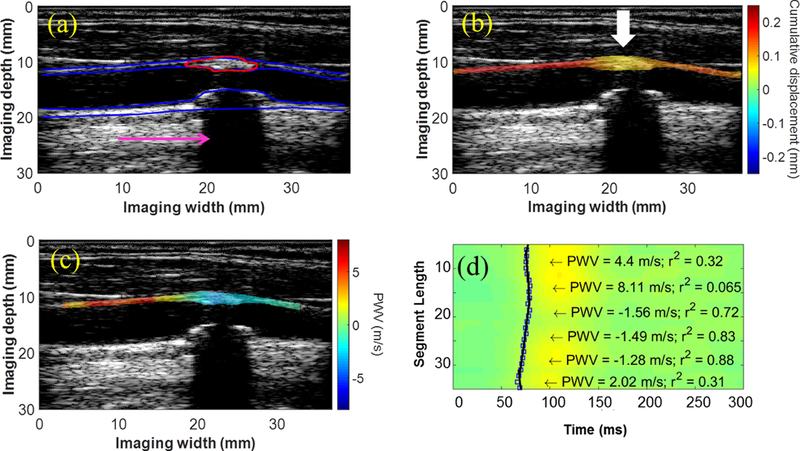
Figure 3:

(a) B-mode image, (b) displacement map, and (c) PWV map from the right CCA of a 76-y.o. male obtained using a conventional ultrasound sequence. The pink arrow points to the acoustic shadow caused by the calcified posterior wall plaque, and the white arrows indicate regions of decreased displacement or pulse wave convergence. (d) Piecewise PWV measurements overlaid on the spatiotemporal map.
