
Figure 4:
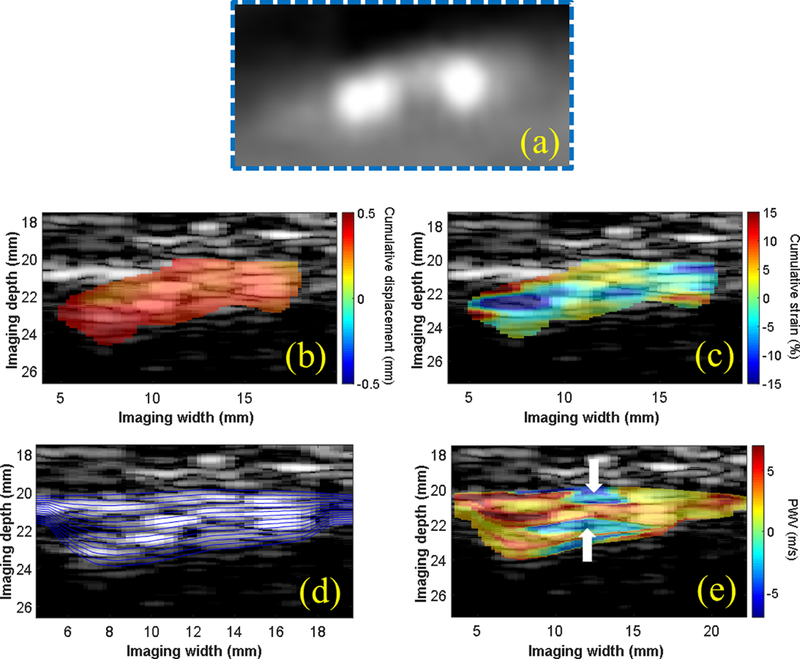
(a) CTA of a plaque region in the right CCA in a 56-y.o. male taken 2 weeks prior to ultrasound imaging. The intra-plaque cumulative displacements (b) appeared uniformly distributed within the plaque ROI, while regions of tissue compression (blue) and elongation (red) were observed on the cumulative strain map. (d) Multiple wall traces were generated for intra-plaque PWV mapping. The PWV map (e) shows regions of negative PWV (white arrows) in between regions of positive PWV that appear to correlate with the two calcified inclusions observed on the enlarged CTA image (a).