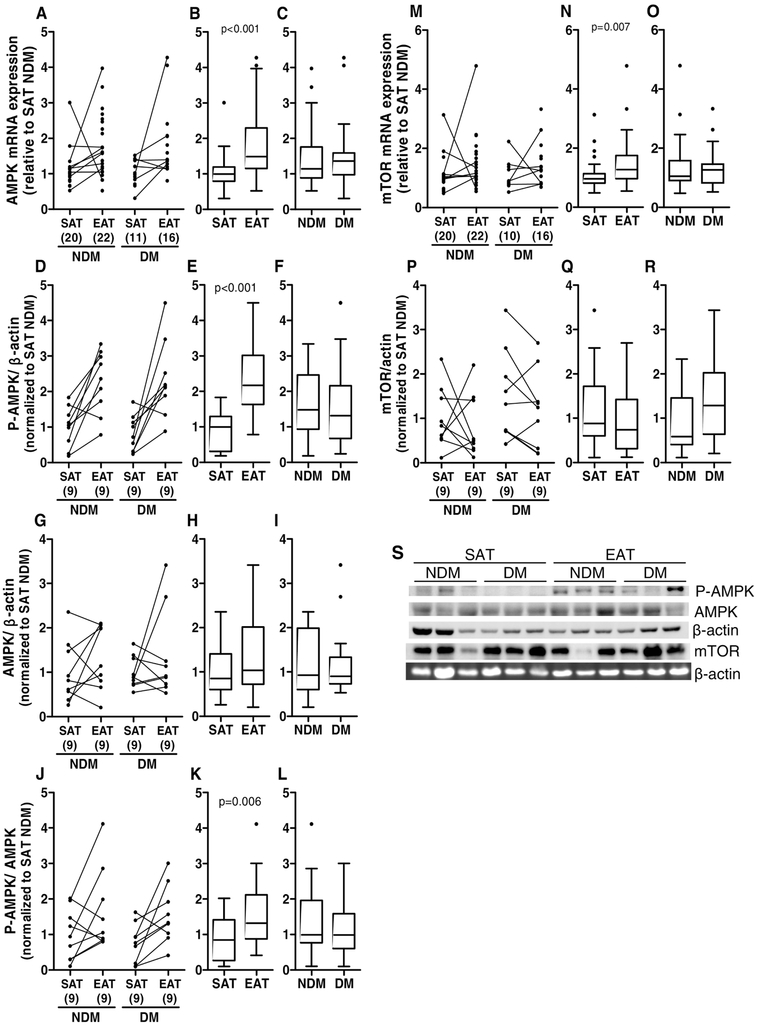
Figure 5.
AMPK and mTOR gene and protein expression and P-AMPK levels in SAT and EAT from HF patients with or without DM. AMPK gene (A-C) and protein (G-I and S) expression, P-AMPK (Thr 172) levels (D-F and S) and mTOR gene (M-O) and protein (P-S) expression were analysed by qRT-PCR and Western blot, respectively. Moreover, the ratio P-AMPK/AMPK was also calculated (J-L). The number of patients is indicated in parentheses in the x axis (A, D, G, J, M and P). Gene and protein expression was calculated relative to SAT NDM after normalization to the reference gene or protein β-actin. To assess the role of tissue type or disease status, nonparametric multivariate ANOVA tests were performed. A p value inferior to 0.05 was considered statistically different.

