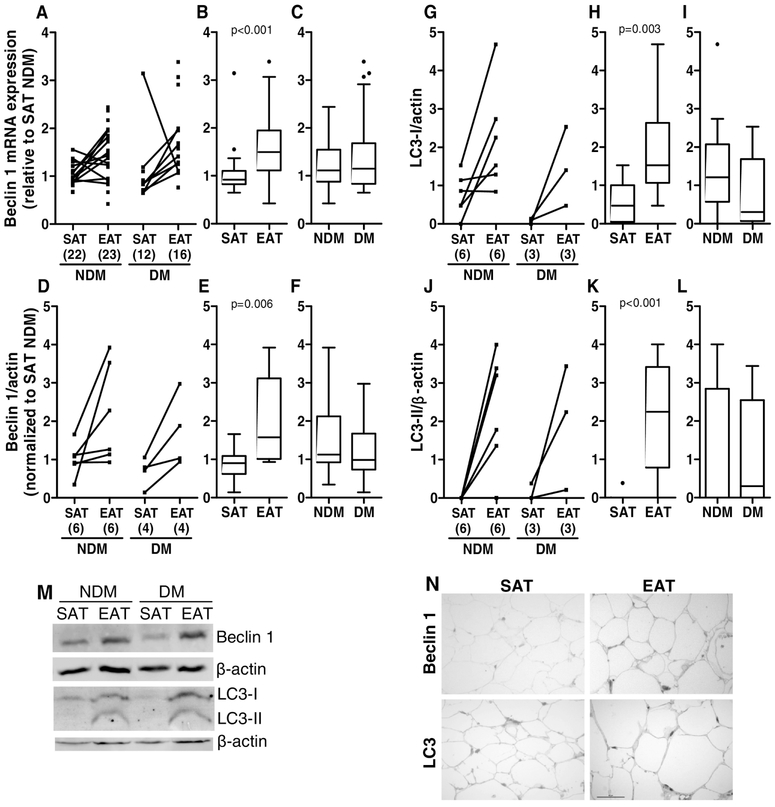
Figure 6.
Beclin 1 and LC3 gene and protein expression in SAT and EAT from HF patients with or without DM. Beclin 1 gene (A-C) and protein (D-F and M) expression and LC3-I (G-I and M) and LC3-II (J-L and M) protein levels were analysed by qRT-PCR and Western blot, respectively. The number of patients is indicated in parentheses in the x axis (A, D, G and J). Gene and protein expression was calculated relative to SAT NDM after normalization to the reference gene or protein β-actin. To assess the role of tissue type or disease status, nonparametric multivariate ANOVA tests were performed. A p value inferior to 0.05 was considered statistically different. Representative histochemical images of Beclin1 and LC3 (N) antibodies staining in SAT and EAT. Magnification, x400. Scale bar, 50 μm.

