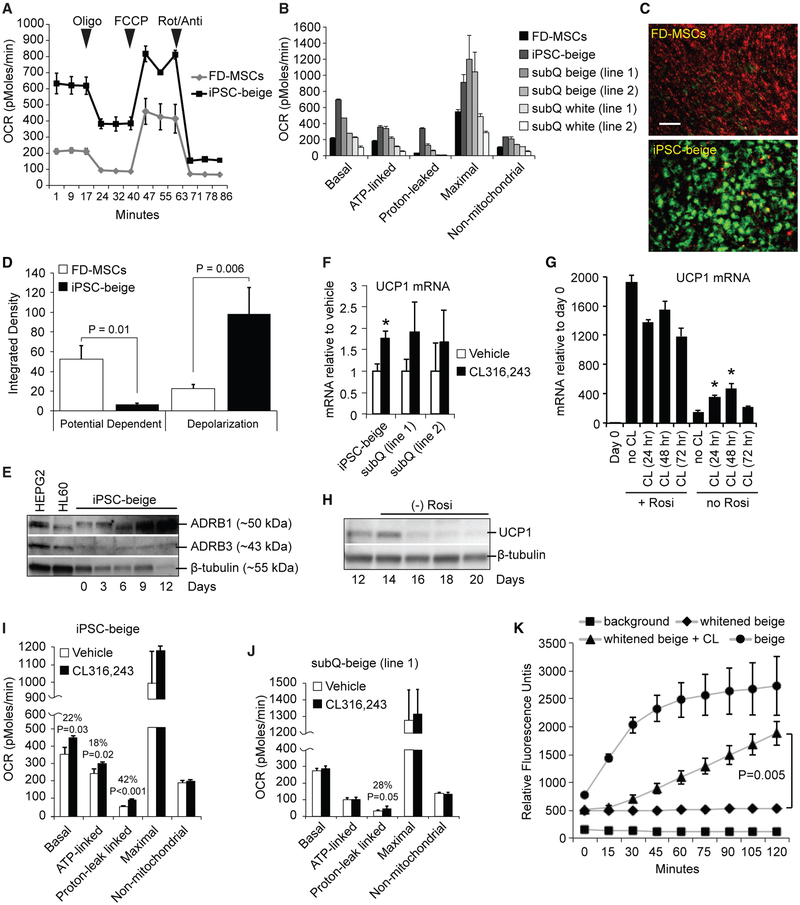
Figure 5. FOXF1-Derived Beige Adipocytes Display Enhanced Respiratory Activity and Uncoupling.
(A) Seahorse XF analyzer profile of FD-MSCs and iPSC-beige adipocytes (day 14) treated with 1.25 μM oligomycin (Oligo), 1 μM para-trifluoromethoxy carbonyl cyanide phenylhydrazone (FCCP), and 2 μM rotenone/antimycin (Rot/Anti) at the indicated times (arrowheads). Means ± SDs of three replicates per time point shown.
(B) Quantitative summary of the Seahorse XF analysis shown in (A) with the addition of two primary subcutaneous beige and white cell lines. Means ± SDs of three replicates per time point shown.
(C) JC-1 assay indicates increased mitochondrial membrane polarization in iPSC-beige adipocytes (green) compared to FD-MSCs (red). Representative image shown. Scale bar, 100 μm.
(D) Quantitation of JC-1 staining shown in (C). Means of three experiments ± SDs and Student’s p value shown.
(E) Western blot time course of adrenoceptor beta 1 (ADRB1) and ADRB3 during iPSC-beige adipocyte differentiation, with β-tubulin as a loading control. HEPG2 and HL-60 cell lines serve as positive controls.
(F) qPCR of iPSC-beige adipocytes and primary subcutaneous beige cell lines treated with CL316,243 (1 μM) for 4 hr. Means ± SDs of three replicates shown. *p < 0.05 using Student’s t test.
(G) qPCR of differentiating iPSC-beige adipocytes treated with CL316,243 (1 μM) for 24, 48, and 72 hr with and without rosiglitazone (1 μM). Means ± SDs of three replicates shown. *p < 0.03 using Student’s t test.
(H) Western blot analysis time course of iPSC-beige adipocytes with rosiglitazone removed from maintenance medium from days 12 to 20. β-Tubulin serves as a loading control.
(I) Quantitative summary of the Seahorse XF analyzer profile of iPSC-beige adipocytes after 4-hr treatment with CL316,243 (1 μM, day 16). Means ± SDs of three replicates per time point and Student’s p value shown.
(J) Quantitative summary of the Seahorse XF analyzer profile of primary subcutaneous beige cells (line 1) after 4-hr treatment with CL316,243 (1 μM, day 16). Means ± SDs of three replicates per time point and Student’s p value shown.
(K) Quantitative summary of fluorescence microplate kinetic reading of iPSC-beige and -whitened beige adipocytes treated with and without CL316,243 (1 μM) for 2 hr before fatty acid uptake reading for an additional 2 hr. Means ± SDs of four replicates per time point and Student’s p value shown.

