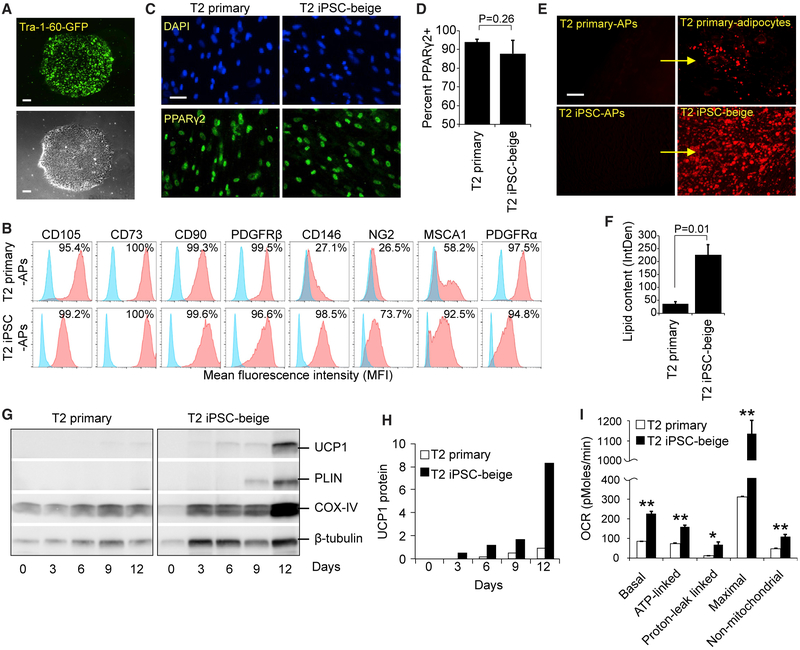
Figure 6. Developmental Reprogramming in a Patient with Compromised Beige Adipogenesis.
(A) Tra-1-60+ live cell staining (upper) and phase contrast (lower) of a representative iPSC colony generated from subcutaneous adipogenic precursors of a 76-year-old patient with type 2 diabetes. Scale bar, 100 μm.
(B) Flow cytometry of MSC and adipogenic precursor (AP) markers expressed on T2 primary-adipogenic precursors and T2-iPSC-adipogenic precursors. FD-MSCs were treated with SB (5 μM) for 2 days to generate T2-iPSC-adipogenic precursors.
(C) PPARγ2+ staining (green) of T2 primary and T2 iPSC-beige adipogenic precursors induced into mature adipocytes with the beige adipogenic cocktail. Scale bar, 50 μm.
(D) Quantitation of PPARγ2+ cells (as shown in C) expressed as means ± SDs (n = 3, 20× images each). Student’s p value shown.
(E) Fluorescence microscopy of BODIPY-stained T2 primary-adipogenic precursors and T2-iPSC-adipogenic precursors after differentiation into adipocytes with the beige induction protocol (12 days). Representative images shown. Scale bar, 100 μm.
(F) Quantitation of lipid accumulation (as shown in E) by ImageJ software, as measured by relative integrated density expressed as means ± SDs (n = 3, 20× images). Student’s p value shown.
(G) Western blot time course of T2 primary-adipogenic precursors and T2-iPSC-adipogenic precursors differentiated into mature adipocytes.
(H) Quantitation of UCP1 protein expression shown in (G); three replicate samples pooled per data point. Data are normalized relative to β-tubulin.
(I) Quantitative summary of the Seahorse XF analyzer profile of T2 primary and T2 iPSC-beige adipocytes (day 14). Means ± SDs of three replicates per time point shown. *p < 0.05 and **p < 0.01 using Student’s t test.

