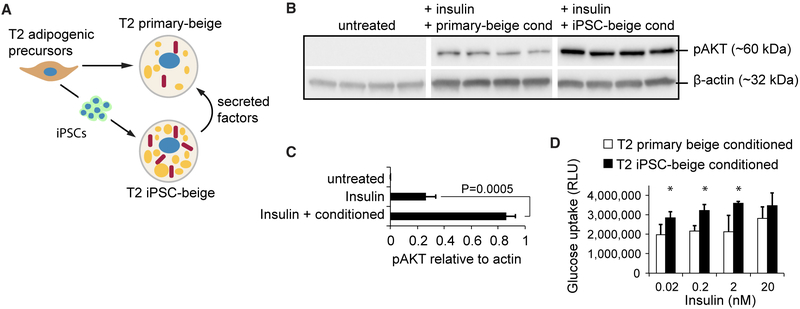
Figure 7. iPSC-Derived Beige Adipocytes Secrete Factors that Improve Insulin Sensitivity and Glucose Uptake.
(A) Schematic representation showing experimental design to test for anti-diabetic secretion potential of iPSC-beige adipocytes.
(B) Western blot analysis of phospho-AKT in T2 primary adipocytes treated with insulin after culture in T2 primary adipocyte conditioned medium (lanes 4–8) or T2 iPSC-beige adipocyte conditioned medium (lanes 9–12).
(C) Quantitation of phospho-AKT protein expression (shown in B). Data are normalized to β-actin protein. Means ± SDs of four replicates and Student’s p value shown.
(D) Glucose uptake analysis of T2 primary adipocytes treated with insulin in the presence of T2 primary adipocyte conditioned medium or T2 iPSC-beige adipocyte conditioned medium. Means ± SDs of six replicates and *p < 0.05 using Student’s t test shown.

