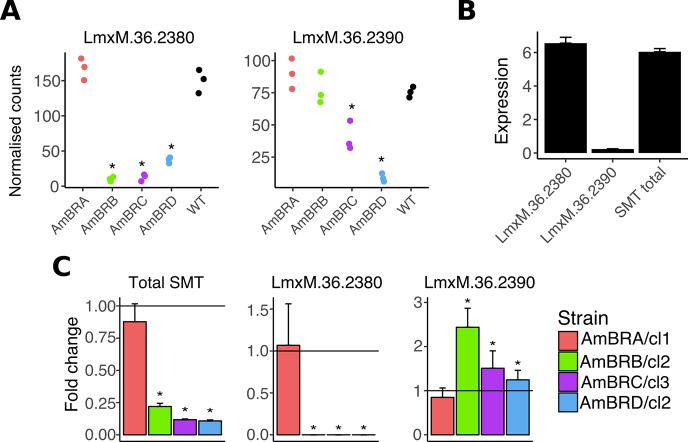
Fig 3. Changes to SMT expression.
A) Expression of SMT genes LmxM.36.2380 and LmxM.36.2390, expressed as normalised counts for individual clones for resistant lines (three independent biological replicates for wild-type). Asterisks represent corrected P values < 0.05. See Supplementary data for full statistical information. B) Wild-type promastigote expression of SMT genes, expressed as fold-expression over GAPDH. Initial Ct values were normalised to standard curves of genomic DNA to allow direct comparison of different qPCR targets (overall SMT values were altered by a factor of two to account for two gene copies), followed by division by similarly normalised values for GAPDH. Note that there is no significant difference (P > 0.05, two-tailed student’s t-test) in values for LmxM.36.2380 and total SMT expression. C) Expression of SMT genes in AmB-resistant lines, as determined by qRT-PCR. Asterisks denote statistically significant differences (P < 0.05) in δCt from wild-type, n = 3. P values for statistical changes were as follows for AmBRB/cl2, AmBRC/cl3 and AmBRD/cl2, respectively: for overall SMT, 4.68 x 10⁻⁶, 9.70 x 10⁻⁶ and 1.58 x 10⁻⁶; for LmxM.36.2380, 4.05 x 10⁻⁵, 2.21 x 10⁻⁴, and 0.00318; for LmxM.36.2390, 4.71 x 10⁻⁴, 0.0228 and 0.0430. See Methods for the statistical approach used.

