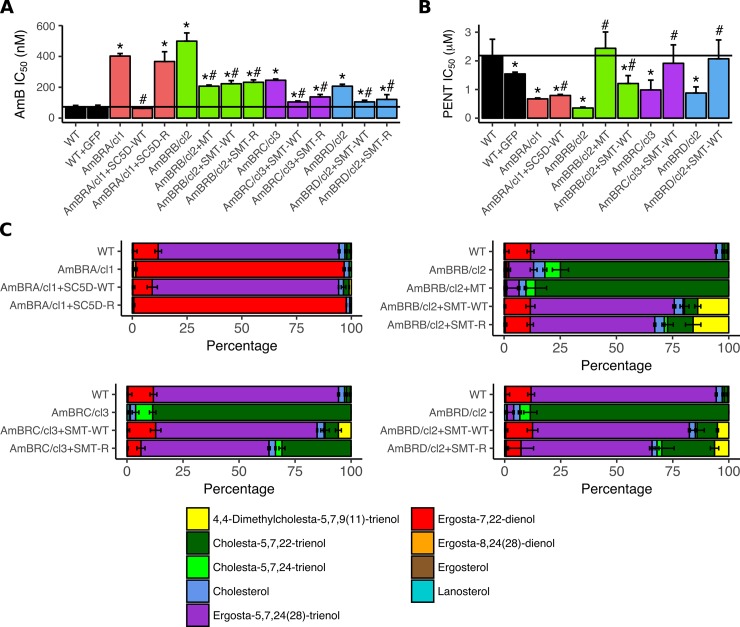
Fig 4. Effects of ectopic expression of candidate AmB resistance-associated genes.
A) AmB sensitivity. Mean values are shown for IC50 with error bars denoting standard deviation (n = 4, except for AmBRB/cl2 and AmBRD/cl2 (n = 6), and AmBRB/cl2 + MT, AmBRB/cl2 + SMT WT and AmBRD/cl2 + SMT WT (n = 8)). Asterisks represent significant differences (P < 0.05), compared to wild-type, hashes between ectopic overexpression lines and their parental AmB-resistant lines. The black vertical bar denotes wild-type sensitivity. See S5 Table for full data, including individual P values. B) Pentamidine (PENT) sensitivity. As for panel (A), with n = 5 for all lines. C) Percentage sterol composition, as determined by GC-MS. Error bars represent standard deviation of the mean, n = 3. MT: Miltefosine transporter.

