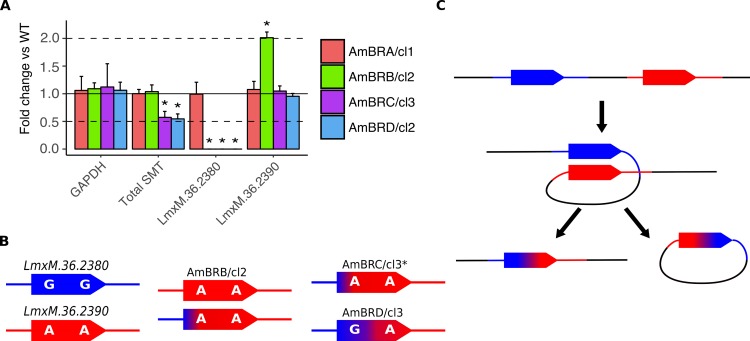
Fig 5. Genomic changes at the SMT locus.
A) Copy number variations in GAPDH (LmxM.36.2350) and SMT genes (LmxM.36.2380 and LmxM.36.2390) as determined by qPCR. Fold changes are calculated as 2-δCt between each line and wild-type, with 5 ng genomic DNA loaded per sample. Asterisks denote statistically significant differences (P < 0.05) in δCt from wild-type, n = 3. Dotted lines denote a halving or doubling of gene copy number. P values for statistically significant changes are as follows: for total SMT, values are 0.00302 and 0,00256 for AmBRC/cl3 and AmBRD/cl2, respectively; for LmxM.36.2380, values are 1.52 x 10⁻⁵, 5.78 x 10⁻⁶ and 4.39 x 10⁻⁴ for AmBRB/cl2, AmBRC/cl3 and AmBRD/cl2, respectively; for LmxM.36.2390, the value for AmBRB/cl2 is 0.00105. See Methods for the statistical approach used. B) Transcript sequences present in wild type (left column) and resistant lines. C) A model for deletion of the intergenic region and formation of a chimaeric SMT gene copy. Homologous recombination leads to generation of an extrachromosomal circular fragment, which is subsequently lost during replication.

