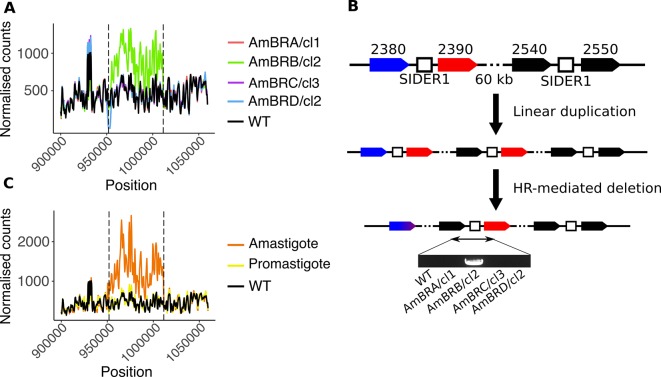
Fig 6. Structural changes associated with SIDER1-mediated amplification.
A) Genome coverage of the region around the SMT locus. Normalised mapped read count for 500 bp windows is plotted against genomic position on chromosome 20 (normalisation was achieved by adjusting counts by the ratio between total mapped read counts for chromosome 20 for that line compared to wild-type). Vertical dotted black lines denote the mid-point position of the two tandem SIDER1 elements. B) A model for structural changes in AmBRB/cl2. Initial SIDER1-mediated linear duplication of a ~60 kb region is followed by homologous recombination-mediated deletion as depicted in Fig 5D. Note that whether these steps happen sequentially or simultaneously cannot be determined. Amplification leads to proximity between LmxM.36.2540 and an SMT gene copy, which is only detectable by PCR in AmBRB/cl2, as shown here (for full gel image see S10 Fig). C) Genome coverage of the region around the SMT locus in a previously selected AmB-resistant amastigote line. See panel (A) for details. Coverage data for a promastigote line derived from the same parent that did not exhibit amplification, as well as the wild-type line used in this study, are included for comparison.

