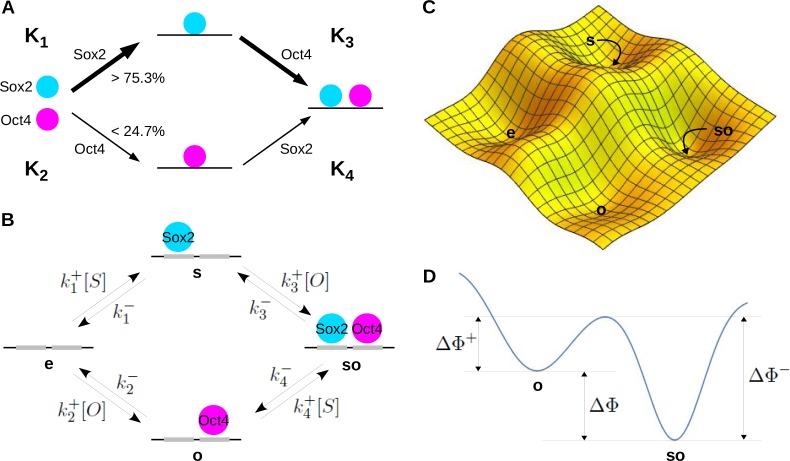
Figure 1. Ordered assembly, graphs and energy landscapes.
(A) Ordered assembly of Sox2 and Oct4 on DNA adapted from (Chen et al., 2014, Figure 6E) and annotated with the quantities described in the Introduction. (B) Corresponding linear framework graph for Sox2 and Oct4 binding to DNA, showing the microstates (vertices), transitions (directed edges) and rates (edge labels). (C) Hypothetical 2D energy landscape for the system in A, showing the free-energy minima corresponding to the four microstates. (D) Hypothetical 1D cross-section through the energy landscape, along a reaction coordinate that traverses the lowest point on the ‘continental divide’ between microstates o and so, as explained in the text. The annotations show the free-energy differences which influence the kinetic labels for binding of Sox2 to o () and for unbinding of Sox2 from so (). The thermodynamic ratio of the binding to unbinding label is determined by the difference in the free-energy minima (), as given by Equation 3.

