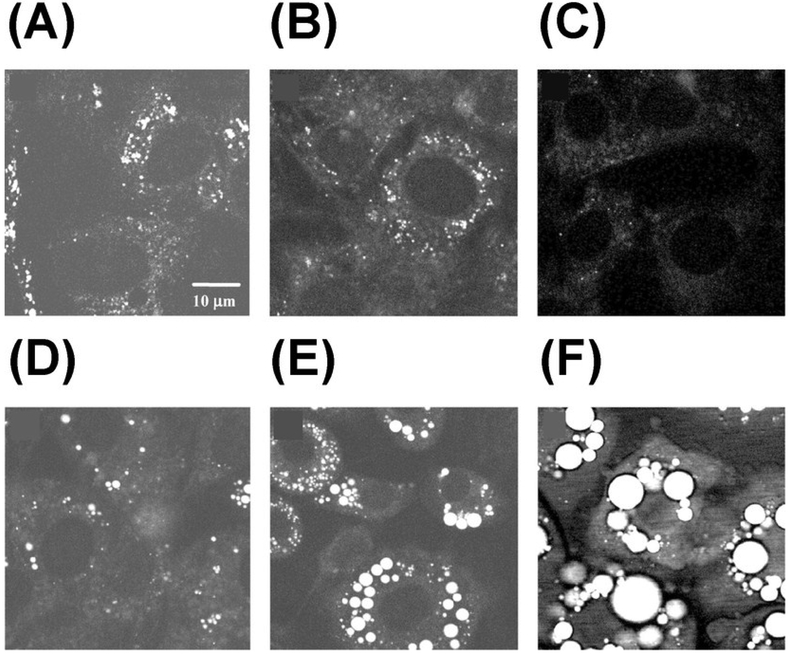
Figure 4.
Monitoring lipid droplet formation during differentiation of 3T3-L1 cells using CARS at 2845 cm-1. Images were taken at different times after adding differentiation induction media: (A) 0 h, (B) 24 h, (C) 48 h, (D) 60 h, (E) 96 h, and (F) 192 h. Republished with permission of American Soc for Biochemistry & Molecular Biology, from Vibrational imaging of lipid droplets in live fibroblast cells with coherent anti-Stokes Raman scattering microscopy, X. Nan, J.-X. Cheng and X. S. Xie, volume 44, edition 11, Copyright (2018); permission conveyed through Copyright Clearance Center, Inc.

