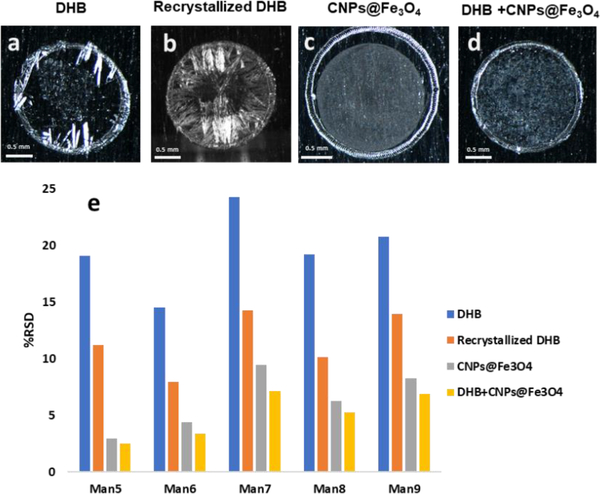
Fig. 1.
Optical images of the MALDI spots (a) 10 μg DHB (b) 10 μg DHB after recrystallization (c) 0.1 μg CNPs@Fe3O4 NCs and (d) 10 μg DHB+0.025 μg CNPs@Fe3O4 NCs. (e) the relative standard deviations of the peak intensities for glycans derived from RNase B, acquired three times by automatic measurements on three different spots, using different matrices. DHB (blue), recrystallized DHB (orange), CNPs@Fe3O4 NCs (gray), and DHB+CNPs@Fe3O4 NCs (yellow).

