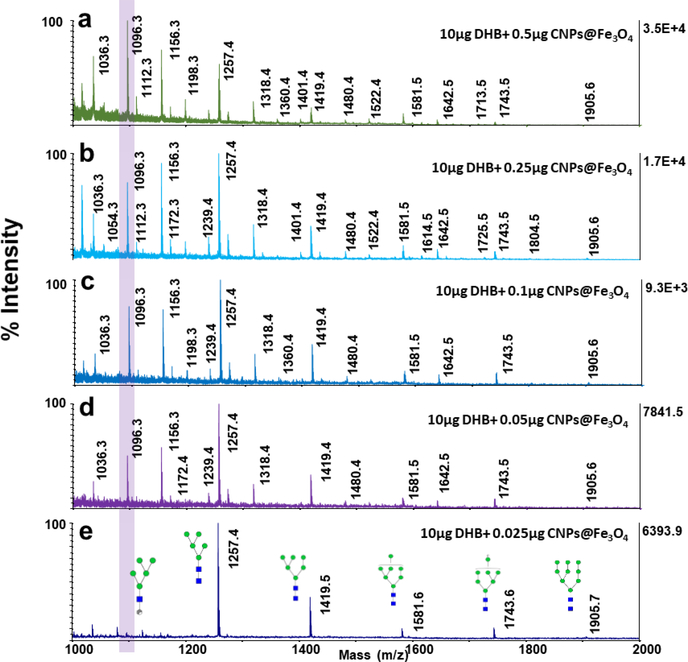
Fig. 4.
MALDI-TOF-MS spectra of N-glycans derived from 100 ng of RNase B using 10 μg DHB mixed with different amounts of CNPs@Fe3O4 NCs (a) 0.5 μg (b) 0.25 μg (c) 0.1 μg (d) 0.05 μg (e) 0.025 μg. Highlight shows the variations in the intensity of the peak at m/z=1096.3, with changing the amount of CNPs@Fe3O4 NCs in the matrix. Symbols as in Fig. 2.

