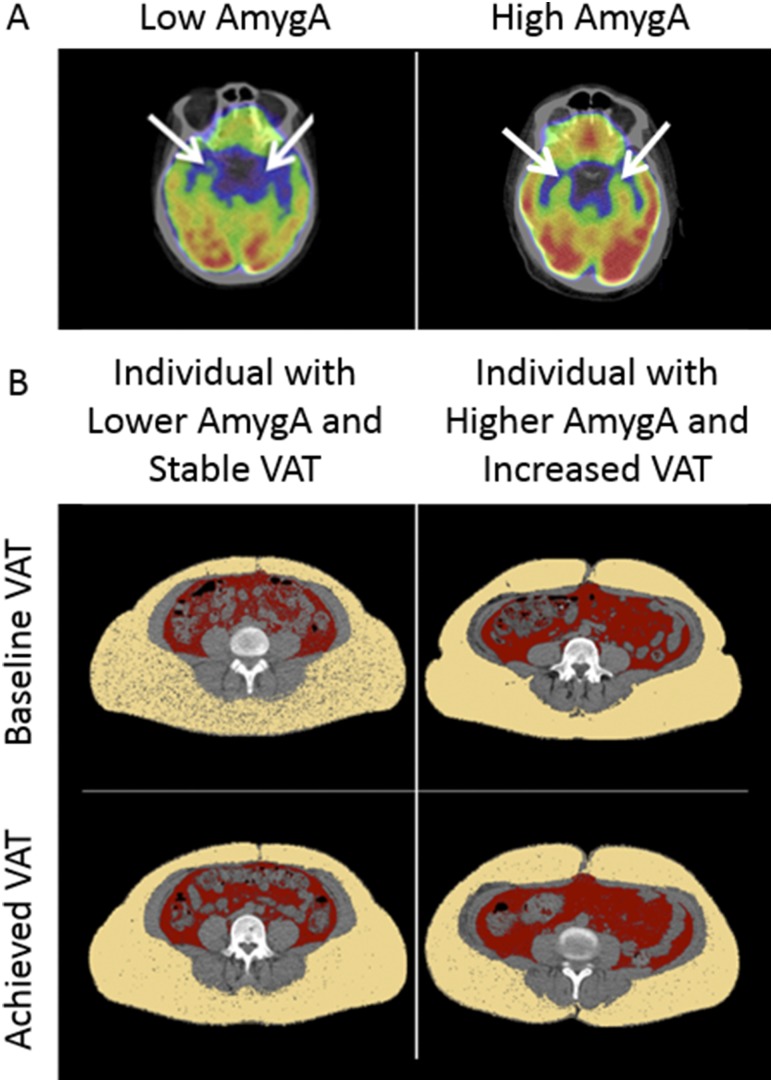
Figure 2.
(A) Comparison of an individual with low amygdalar activity with an individual with high amygdalar activity. The arrows identify bilateral amygdalae in each subject. (B) Comparison of baseline and achieved visceral adipose tissue in an individual with lower baseline amygdalar activity with that of an individual with higher baseline amygdalar activity.

