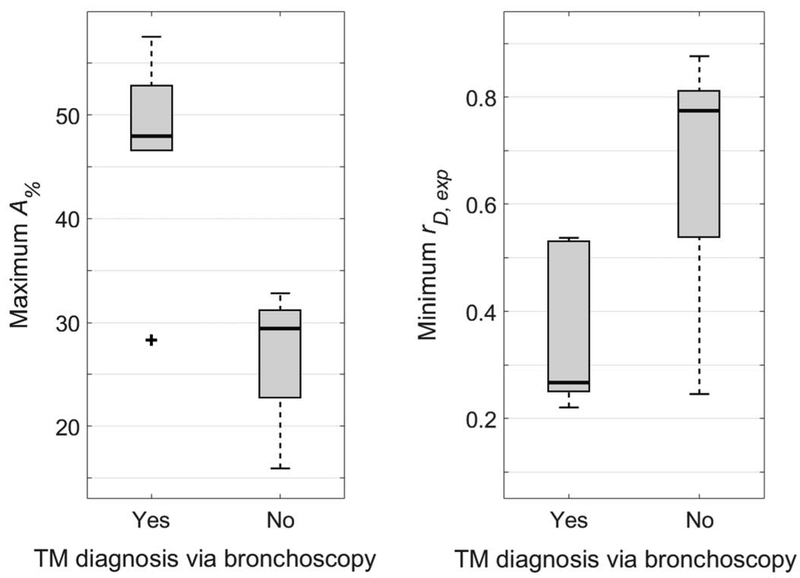
Figure 5.
Comparison of maximum tracheal cross-sectional area reduction percentage between endexpiration and end-inspiration (A% - left) and minimum ratio of tracheal minor-to-major diameter at endexpiration (rD,exp - right) to positive or negative diagnosis of tracheomalacia (TM) via clinical bronchoscopy. Both measures were found to correlate with clinical diagnosis of TM (P < 0.001 and P = 0.008 for A% and rD,exp, respectively). Plot elements are represented as follows: median (black line), interquartile range (grey box), data within 1.5 times the interquartile range below 25% and 75% (black whiskers), and data outside this range (black cross).

