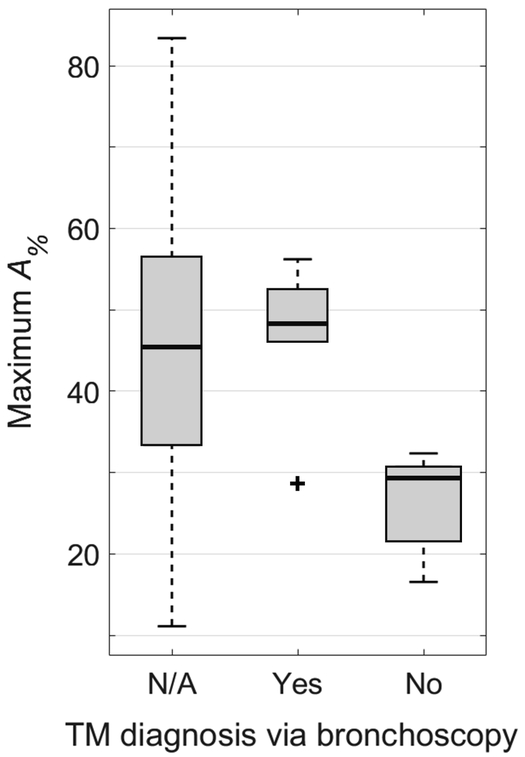
Figure 6.
Comparison of maximum tracheal cross-sectional area reduction percentage between endexpiration and end-inspiration (A%) between subjects with positive findings of TM via clinical bronchoscopy, subjects with negative findings of TM via clinical bronchoscopy, and subjects who did not undergo a clinical bronchoscopy (Yes, No, and N/A groups, respectively). There is a statistically significant difference between the No and N/A groups (P = 0.032) and no statistically significant difference between the Yes and N/A groups (P = 0.707). The range of A% in the N/A group spans across all values associated with both positive and negative findings of TM, suggesting that several patients may have undiagnosed TM and would stand to benefit from tracheal collapse evaluation. Plot elements are represented as follows: median (black line), interquartile range (grey box), data within 1.5 times the interquartile range below 25% and 75% (black whiskers), and data outside this range (black cross).

