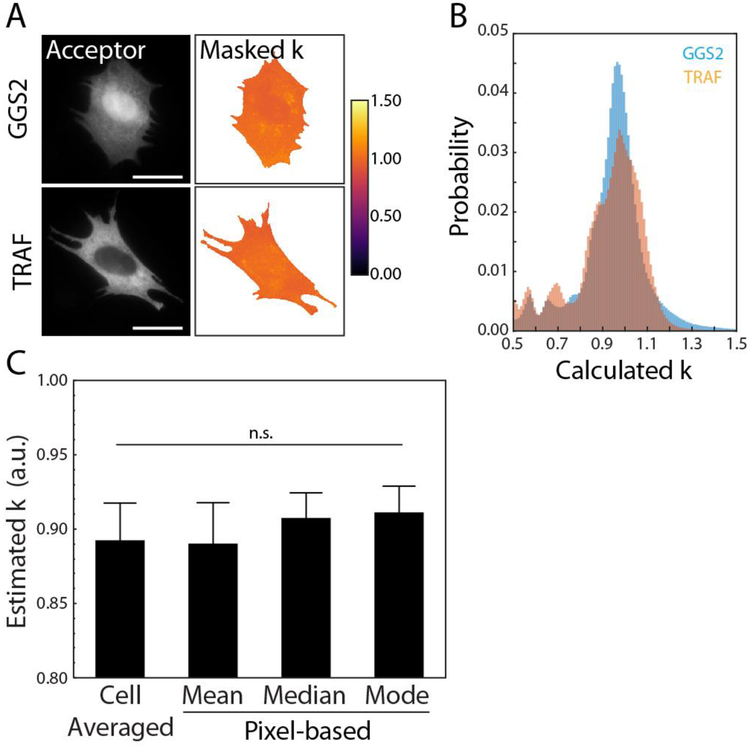
Figure 2.
(A) Sample acceptor images of vinculin −/− MEFs expressing either GGS2 or TRAF and the associated cell-masked, pseudo-colored images of the calculated k factor. Scale bars are 25μm. (B) Histogram of pixel data corresponding to either GGS2 (blue, n = 74 cells) or TRAF (orange, n = 39 cells) from all cells in a single experiment. (C) Comparison of the four methods used to estimate k. Methods include a previously described cell-averaged approach (43) and our pixel-based approach using the mean, median, or mode. Data and error bars are the mean and standard error, respectively, from both constructs across four independent experiments. Following a Levene’s test, an ANOVA did not find statistically significant differences in the means.

