
Figure 2.
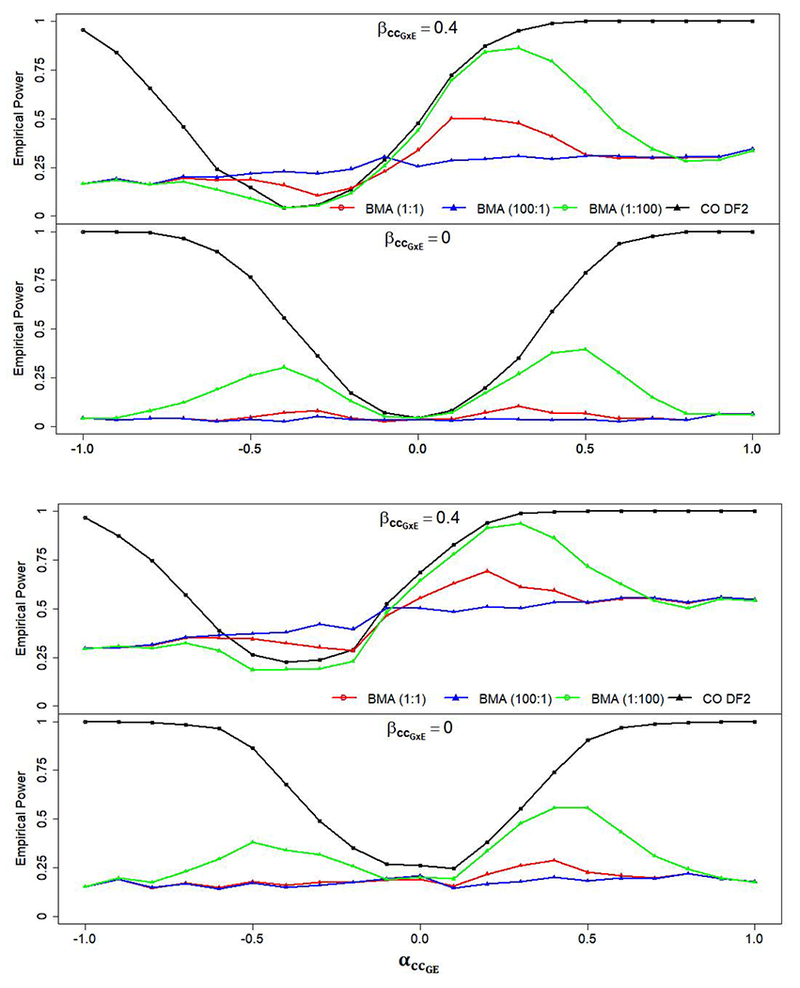
Empirical Power measured across a range r = [−1.0, +1.0] of G-E association with and without a GxE interaction and marginal effect for CO DF2 and BMA DF2 approaches. BMA(100:1) and BMA (1:100) represent an analysis of BMA DF2 with prior weighting based on a 100:1 and 1:100 odds of a CC model being more appropriate than a CO model respectively. A) OR(GxE)=1.0 & OR(G)=1.0, B) OR(GxE)=1.5 & OR(G)=1.0, C) OR(GxE)=1.0 & OR(G)=1.2, D) OR(GxE)=1.5 & OR(G)=1.2.