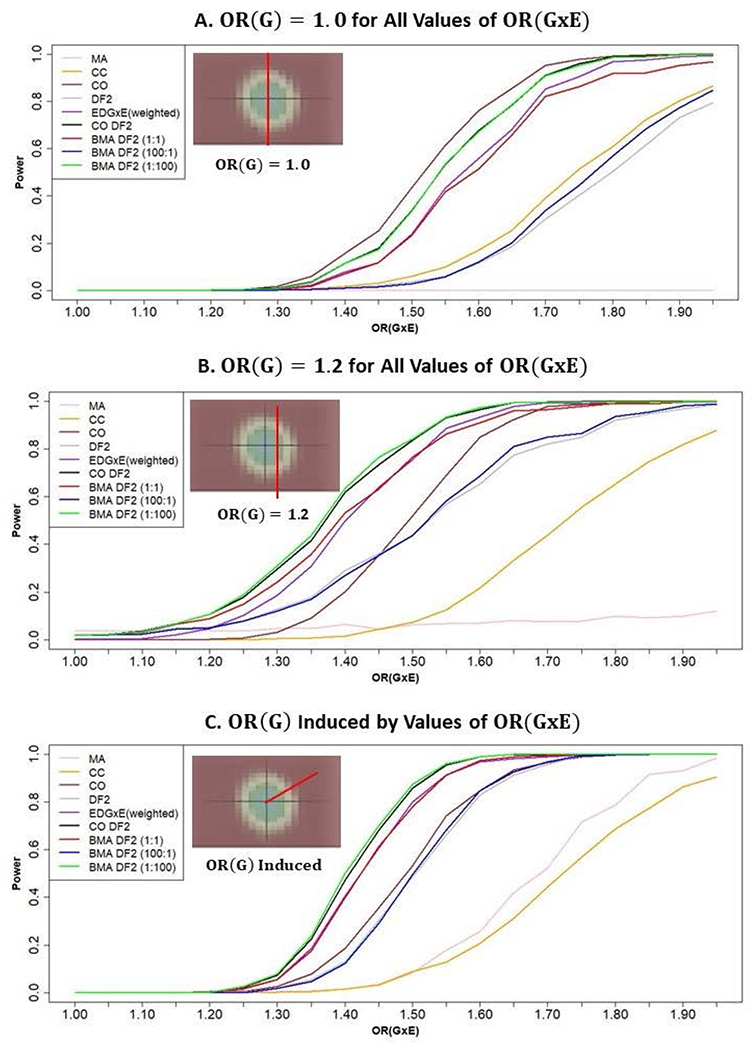
Figure 3.

Empirical power vs. OR(GxE) with independence between G and E (plots A-C). Based on genome-wide simulations of 1 million SNPs with 1000 repetitions and one designated causal SNP in each repetition. A) OR(G) = 1.0 & OR(E) = 1.0; B) OR(G) = 1.2 & OR(E) = 1.2; C) Both OR(G) and OR(E) are induced by the interaction effect and are not held constant.
