
Fig. 7.
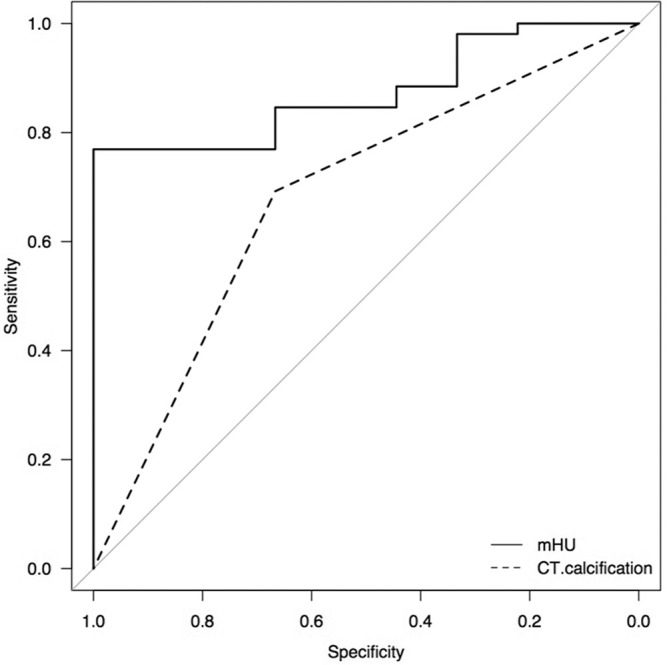
Receiver operating characteristic curve showing that the mHU discriminates the growth pattern better than the presence of calcification on computed tomography (P= 0.016). mHU: mean Hounsfield unit.
Official websites use .gov
A
.gov website belongs to an official
government organization in the United States.
Secure .gov websites use HTTPS
A lock (
) or https:// means you've safely
connected to the .gov website. Share sensitive
information only on official, secure websites.
Receiver operating characteristic curve showing that the mHU discriminates the growth pattern better than the presence of calcification on computed tomography (P= 0.016). mHU: mean Hounsfield unit.