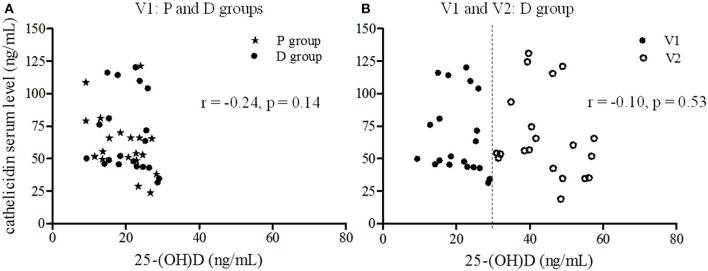
Figure 4.
Correlation between 25-(OH)D and cathelicidin serum levels. The relationship between cathelicidin and 25-(OH)D serum levels was estimated using Pearson correlation. (A) Correlation at inclusion (V1) for all volunteers (star P group, circle D group) (r = −0.24, p = 0.14). (B) Correlation before (V1: dark circle) and after the supplementation period (V2: light circle) for D group (r = −0.10, p = 0.53).

