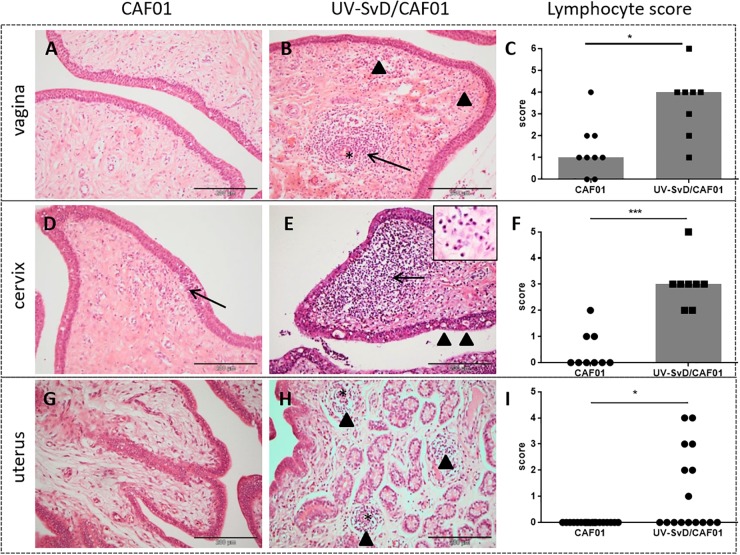
FIGURE 2.
Histopathological changes including lymphocyte counts in the minipig vagina, cervix and uterus. The first and second column show representative pictures from the CAF01 and the UV-SvD/CAF01 groups, respectively. Each row represents the different anatomical locations; the vagina, cervix and uterus. The scale bar equals 200 μm. (A) In the vagina of the CAF01-group, there is a low number of lymphocytes scattered in the subepithelial stroma. (B) UV-SvD/CAF01 group, vagina. A profound perivascular infiltration of lymphocytes is noted (arrow), and also a subepithelial diffuse infiltration of lymphocytes (arrowheads). Blood vessel marked with asterisk (∗) (C) Comparison of the semiquantitative lymphocyte infiltration scores, showing a significant difference in the lymphocyte score in the vagina of the two groups. Each dot represents one animal. Bars show median. (D) CAF01-group, cervical tissue, where a small subepithelial lymphocyte infiltration is extending into the epithelium (arrow) (E) In the cervix of the UV-SvD/CAF01 group, there is a dense subepithelial infiltration of lymphocytes (arrow) and plasma cells (insert, arrow). Intraepithelial vacuoles (arrowheads) and lymphocytes are also noted (F) Comparison of the semiquantitative lymphocyte infiltration scores, showing a highly significant difference in the lymphocyte score in the cervix of the two groups. Each dot represents one animal. Bars show median. (G) In the uterus, stromal edema is found in the CAF01-group (H) In addition to stromal edema, multiple small perivascular lymphocytic accumulations (arrowheads) are seen in the UV-SvD/CAF01 group. Blood vessel marked with asterisk (∗) (I) Comparison of the semiquantitative lymphocyte infiltration scores, showing a significant difference in the lymphocyte score in the uterus of the two groups. Each dot represents one uterine horn. Bars show median. Statistics: Mann-Whitney test. Asterisks (∗) indicate the level of significance: ∗P 0.01 to 0.05, ∗∗P 0.01–0.001, and ∗∗∗P < 0.001.

