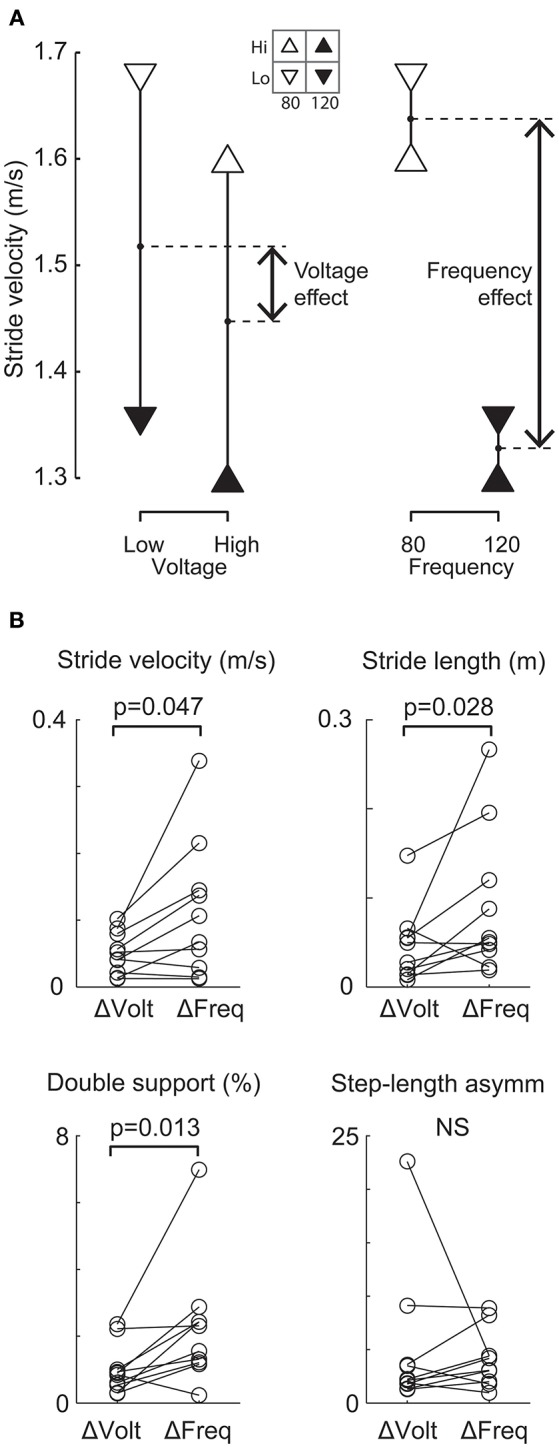
Figure 3.

Comparison of relative effects of changing frequency and voltage on gait variables. (A) Representative patient's mean stride velocity data at each of four STN-DBS settings. The same data are arranged differently to show the mean effect of changing voltage (left) and the mean effect of changing frequency (right). For this patient, the change in stride velocity was larger when changing frequency from 120 to 80 Hz compared to a change in voltage from a high (4.3 and 5.2 V left and right electrodes respectively) to a low value (3.5 and 4.2V left and right electrode respectively). (B) All patients' frequency (ΔFreq) and voltage (ΔVolt) effects for each gait variable. The change due to ΔFreq was significantly (p < 0.05) larger than the change due to ΔVolt for stride velocity, stride length and double-support time.
